The 50/30/20 budget rule splits every take-home dollar across needs, wants, and savings — a simple framework that works because it is forgiving enough to actually stick with.
The fastest way to make someone hate budgeting is to hand them a 30-category spreadsheet and ask them to log every coffee for a month. Most people quit by week two. That is why a budgeting framework that has only three categories — and that allows roughly 30% of your income for "anything you want" — has quietly become the default starting point for American personal finance education.
This is the 50/30/20 rule. It is not the most precise budgeting method. It is the one most people actually use long enough to see results. This guide walks through exactly how it works, what counts where, how to adjust it for higher cost-of-living cities, and how to get the whole system running in under an hour.
What the 50/30/20 Rule Is
The 50/30/20 rule splits your monthly take-home pay (the amount actually deposited in your account, after tax and pre-tax deductions like 401(k) contributions and health insurance premiums) into three buckets:
- 50% for needs — essential, hard-to-cut expenses: housing, utilities, basic groceries, transportation, insurance, and minimum debt payments.
- 30% for wants — discretionary spending you would cut if you lost your job: dining out, streaming, hobbies, travel, gym, takeout coffee, new clothes beyond replacement.
- 20% for savings and debt payoff — emergency fund contributions, retirement contributions, brokerage contributions, and any extra debt payments above the minimum.
The rule was popularized in All Your Worth: The Ultimate Lifetime Money Plan, co-authored in 2005 by then-Harvard-professor Elizabeth Warren and her daughter Amelia Warren Tyagi. They derived the ratios from years of bankruptcy research — specifically, the spending pattern of households that did not end up in financial trouble. The numbers are not arbitrary. They reflect the rough proportions at which a typical American household stays solvent without feeling deprived.
Why It Works When Other Budgets Fail
Most budgeting failures share the same root cause: the budget is too restrictive to live in. People draft an aspirational spreadsheet on Sunday night, overspend on Tuesday's lunch, feel like failures by Friday, and abandon the whole project by the following Sunday. The 50/30/20 rule is engineered specifically against that failure mode.
Three design choices make it durable:
The wants bucket is generous on purpose. Thirty percent for guilt-free, no-tracking discretionary spending is enough to live a normal social life in the US. You can go to dinner, take a weekend trip, buy concert tickets — without justifying it to a spreadsheet. The psychological room to breathe is what keeps the system running for years rather than weeks.
The categories are coarse, not granular. You do not classify between "groceries" and "household goods" and "personal care." You ask one question: is this transaction a need, a want, or a saving? Three buckets, three minutes a week.
The math is forgiving. Going 5% over on wants in a single month is not a crisis. The framework absorbs normal variation. Compare that to zero-based budgeting, where any overspend in any category must be reconciled by a corresponding under-spend somewhere else.
The trade-off, honestly stated: 50/30/20 will not optimize your spending to the dollar. If your goal is to minimize total outflows — for example, you are saving aggressively for early retirement — a more granular method will do better. For the 80% of households whose goal is simply "stop running short and start building wealth," 50/30/20 is usually the right framework to start with.
What Counts as a Need, a Want, or a Saving
The most common 50/30/20 question is also the most contested: where does this expense go? The decision rules below cover roughly 95% of edge cases.
Needs (50%)
A "need" is something you would still pay for if your household income dropped by 30% next month. Apply that test honestly.
- Rent or mortgage principal + interest
- Property taxes and HOA fees
- Utilities (electric, gas, water, basic internet)
- Health insurance premiums (if not pre-tax)
- Auto insurance and renter's/homeowner's insurance
- Basic groceries (food eaten at home)
- Essential transportation (gas, public transit, basic car maintenance)
- Minimum debt payments (credit card minimums, student loan minimums, car payment, mortgage)
- Childcare, if it is required for you to work
- Prescription medications
Wants (30%)
A "want" is something you would cut if you lost your income. The honest test is uncomfortable; that is the point.
- Dining out, takeout, delivery, coffee shops
- Streaming services and subscriptions
- Cable TV beyond a basic plan
- Gym memberships, hobby spending
- Concerts, movies, travel
- Clothing beyond replacement
- The "nicer" tier of phone, internet, car
- Premium grocery items, prepared foods
- Gifts beyond modest amounts
A car is a useful illustration of the want/need line. Having basic transportation is a need. Having a $750-a-month leased luxury SUV is partly a want — the portion above what a reliable used sedan would cost belongs in wants, not needs.
Savings and Debt Payoff (20%)
The savings bucket is everything that increases your net worth.
- Emergency fund contributions
- 401(k) and IRA contributions (only the after-tax portion, since pre-tax 401(k) already came off the top)
- Brokerage account contributions
- HSA contributions (often misclassified as needs — they are savings)
- 529 plan contributions
- Extra debt payments beyond the minimums
- Sinking funds for predictable irregular expenses
A common mistake is putting your full mortgage payment into needs. The interest portion is a need; the principal portion is forced savings (it builds equity). For simplicity, many people just keep the whole payment in needs, which is fine — the rule is forgiving enough that this rounding error rarely changes the picture.
A Real-World Example
Take a single-income household with $6,000 monthly take-home pay (roughly $90,000 gross annually in a moderate-tax state).
Target buckets at 50/30/20:
- Needs: $3,000
- Wants: $1,800
- Savings: $1,200
A realistic month might look like:
| Category | Amount | Bucket |
|---|---|---|
| Rent | $1,800 | Need |
| Electric, gas, water | $180 | Need |
| Internet | $70 | Need |
| Auto insurance | $130 | Need |
| Renter's insurance | $15 | Need |
| Health insurance (post-tax portion) | $200 | Need |
| Groceries | $400 | Need |
| Gas + car maintenance | $180 | Need |
| Minimum credit card payment | $50 | Need |
| Needs total | $3,025 | 50.4% |
| Dining out & coffee | $400 | Want |
| Streaming + subscriptions | $80 | Want |
| Gym | $50 | Want |
| Hobbies & shopping | $300 | Want |
| Travel sinking fund | $300 | Want |
| Phone (above basic plan) | $40 | Want |
| Gifts | $50 | Want |
| Wants total | $1,220 | 20.3% |
| Roth IRA contribution | $500 | Saving |
| Brokerage contribution | $250 | Saving |
| Extra credit card payment | $200 | Saving |
| Emergency fund | $300 | Saving |
| Savings total | $1,250 | 20.8% |
This household is running 50/20/30, not 50/30/20 — they are saving slightly more than the rule suggests, and spending less on wants. That is a healthy variation; saving more is rarely a mistake. The rule is a floor on savings (20%), not a ceiling.
Plug your own numbers into the Budget Calculator (50/30/20) to see your current breakdown in 60 seconds. Most first-timers are surprised by where their ratio actually falls.
Adjusting the Rule for High Cost of Living
The 50/30/20 ratios assume a moderate cost of living. In genuinely expensive cities — San Francisco, New York, Boston, San Jose, Honolulu — rent alone can push past 40% of take-home pay, making the strict 50% needs cap mathematically impossible without roommates or a long commute.
Two reasonable adjustments:
60/20/20. Acknowledges the unavoidably higher needs share in expensive cities, while preserving the 20% savings floor. The wants bucket compresses but stays meaningful.
50/20/30 (savings-priority). Used by households pursuing financial independence or playing catch-up after a late start. Wants drops to 20%, savings rises to 30%. This is a more aggressive posture; sustainable for 5–10 years, but rarely comfortable for a working lifetime.
The one ratio worth defending almost no matter what: the 20% savings floor. If your needs are pushing past 60% of income, the problem to solve is not "lower savings" — it is "find cheaper housing or earn more." A budget that protects savings at the cost of wants is recoverable; a budget that cannibalizes savings is not, because the lost compounding never comes back.
Setting It Up in 30 Minutes
The setup is genuinely quick. Block 30 minutes this Sunday and work through these five steps.
- Find your real take-home pay. Look at three recent paychecks and average the net deposit (after taxes, 401(k), pre-tax insurance). This is your denominator.
- Multiply by 0.50, 0.30, and 0.20 to get your target needs, wants, and savings amounts. These are your monthly ceilings (for needs and wants) and floor (for savings).
- Sort your last 60 days of transactions into the three buckets using the rules above. Most banks and credit cards export transactions to CSV in under a minute. Excel, Google Sheets, or any free budgeting app will tally categories. You are looking for your real ratio today.
- Identify the biggest gap between your real ratio and the 50/30/20 target. Most people discover wants is the lever to pull — often 35-45% of take-home, frequently driven by dining out, subscriptions, and unstructured shopping.
- Automate the savings transfer first. On the day after payday, move 20% of your net pay into savings, retirement, and debt-payoff destinations before anything else has a chance to be spent. Pay yourself first. The needs bucket regulates itself (the rent is the rent); the wants bucket flexes to whatever is left. The 20% savings is non-negotiable once automated.
That last point — automation — is the single most important step. A budget you have to decide to follow each month is fragile. A budget that runs itself in the background is durable. The 30 minutes you spend setting up automated transfers is the highest-impact half-hour of any budgeting system.
When 50/30/20 Doesn't Work
The rule is a default, not a universal law. There are real cases where it does not fit:
- You are paying down very high-interest debt. During an aggressive debt-payoff sprint, 50/20/30 (with the 30% all going to debt) often makes more sense for 12–24 months.
- You are pursuing financial independence (FIRE). Savings rates of 40–60% are the entire point. The wants bucket gets compressed deliberately.
- You are retired or near-retired. The savings bucket inverts — you are now spending from savings rather than contributing. A draw-down framework replaces the 50/30/20 ratios.
- Your income is highly irregular (freelancers, commissioned sales, seasonal work). Budget against your 12-month rolling average net income, not month-to-month.
- You have very low income. Below roughly $35,000 gross in the US, "needs" can easily consume 70%+ of take-home pay, and there is no realistic way to hit a 20% savings rate without first increasing income. The framework still gives you the right target; it just identifies the income side, not the spending side, as the real lever.
In all these cases, the underlying principle — assign every dollar a job, protect savings first — still applies. The specific 50/30/20 ratios are a starting point that should flex to your real life.
Frequently Asked Questions
Should I use gross or net income for 50/30/20? Net (take-home) is the original framework. It assumes income tax and pre-tax deductions like 401(k) and health insurance are already paid before the buckets divide. If you contribute to a 401(k) pre-tax, that contribution does not count again in the 20% savings — it is already accounted for in the gap between gross and net.
Does my mortgage principal count as savings? Strictly, yes — paying down principal builds home equity, which increases net worth. Practically, most people lump the entire mortgage payment into needs for simplicity. Either is defensible; pick one and stay consistent.
What if I cannot hit 20% savings right now? Start where you actually are. Track your real ratio for one month, then improve it by one percentage point per month. Going from 5% savings to 6% feels small; doing it twelve times in a row gets you to 17%. Compound improvement beats heroic willpower.
Where do irregular expenses (car insurance, holidays) go? Build sinking funds — small monthly transfers into a labeled savings account so the money is already there when the bill arrives. Annual car insurance of $1,200 is $100 a month into a "car insurance" sinking fund. This stays in your savings bucket while you contribute to it; it becomes a need in the month you actually pay the bill.
Can I include my employer 401(k) match in the 20%? No — the match is free money on top, not part of your contribution. Count only the dollars you are setting aside from net pay.
How does 50/30/20 compare to zero-based budgeting or YNAB? Zero-based budgeting (where every dollar gets assigned to a specific category before the month begins) is more precise and more demanding. YNAB is the most popular software embodiment. 50/30/20 trades some precision for much lower friction; many users start with 50/30/20 and graduate to zero-based budgeting once the habit is established.
Next Steps
If you do nothing else this week:
- Run your last month's spending through the Budget Calculator (50/30/20). See your real ratio.
- Automate one savings transfer for the day after your next paycheck. Any amount. Build the automation muscle.
- Identify the single wants subcategory most out of line with your target — usually dining out, subscriptions, or unplanned shopping — and reduce it by 25% next month. Not 100%. Twenty-five percent. Sustainable changes beat dramatic ones every time.
The 50/30/20 rule is not the optimal budget. It is the budget that the largest number of people can actually stay with for a decade. In personal finance, the decade-long average always beats the perfect month.
Run the numbers
Everything below came out of this site's own Budget Calculator (50/30/20). The figures are not quoted from anywhere else: each row is one run of the same calculation the tool page performs, using August 2026 rules. Put the same inputs in and you will get the same output.
How the result moves with income
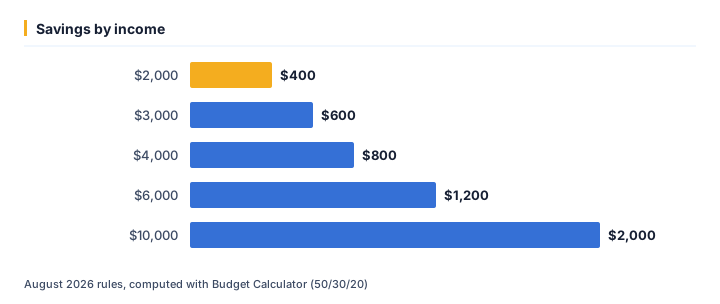
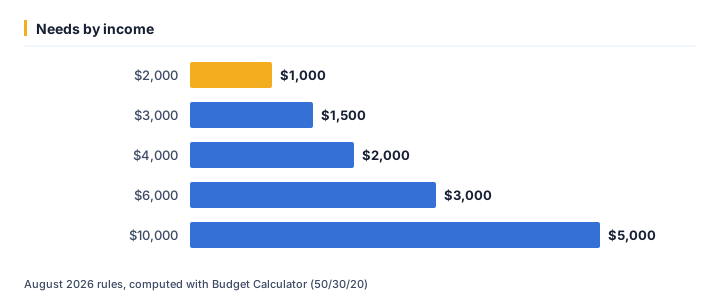
We ran 5 values of income through the calculator and left every other input at its default. As of August 2026, the output was:
| Income ($) | Savings ($) | Needs ($) | Wants ($) |
|---|---|---|---|
| 2,000 | 400 | 1,000 | 600 |
| 3,000 | 600 | 1,500 | 900 |
| 4,000 | 800 | 2,000 | 1,200 |
| 6,000 | 1,200 | 3,000 | 1,800 |
| 10,000 | 2,000 | 5,000 | 3,000 |
Running income from $2,000 up to $10,000 moves savings from $400 to $2,000 — a spread of $1,600. That gap is the part a single headline rate never shows.
The same runs seen through needs
At $2,000, needs works out to $1,000; at $10,000 it is $5,000. Looking only at savings tends to understate how much the outcome shifts across that range.
One example, straight from the API
The middle row above (income = $4,000) is not a rounded illustration — it is exactly what /api/v1/tools/budget-calculator/calculate returns for that input, August 2026 rules:
{
    "tool": "budget-calculator",
    "inputs": {
        "income": 4000
    },
    "result": {
        "needs": 2000,
        "wants": 1200,
        "savings": 800
    }
}
Assumptions behind these figures
| Input | Value |
|---|---|
| Income | $4,000 |
| As of | August 2026 |
| Method | identical to /tools/budget-calculator |
Rates, thresholds and typical costs change over time; the numbers above are accurate as of August 2026, not a permanent guarantee. For your own situation, open the Budget Calculator (50/30/20) and enter your real numbers — the calculator runs the same code that produced every figure on this page.
Ready to crunch your numbers?
Open the Budget Calculator (50/30/20) and get an answer in seconds.
Editorial Team
We write plain-English money guides and build the free calculators behind them.