$10,000 invested today at a historic 7% annual return becomes roughly $19,700 in 10 years, $38,700 in 20 years, and $76,100 in 30 years — and almost all of that growth happens in the final third of the timeline, which is why starting early dominates investing more later.
A single $10,000 investment left alone for several decades is one of the cleanest examples of compounding in personal finance — and one of the most surprising. The growth is slow for years, then suddenly fast, in a way that frustrates anyone who hopes to "see results quickly" and rewards anyone willing to wait. This guide shows exactly what $10,000 becomes at the most commonly cited annual return rates, what the year-by-year curve looks like, and why the last decade carries most of the total return.
The Quick Answer: $10,000 at 5%, 7%, and 10%
The S&P 500's historical long-term average return is approximately 10% nominal (about 7% after inflation). High-yield savings accounts currently pay around 4-5%. A diversified portfolio with bonds typically returns 5-7% long-term. These three rates bracket the realistic range for most investors:
| Years | At 5% APY | At 7% APY (typical real return) | At 10% APY (S&P historical) |
|---|---|---|---|
| 1 | $10,500 | $10,700 | $11,000 |
| 5 | $12,763 | $14,026 | $16,105 |
| 10 | $16,289 | $19,672 | $25,937 |
| 15 | $20,789 | $27,590 | $41,772 |
| 20 | $26,533 | $38,697 | $67,275 |
| 25 | $33,864 | $54,274 | $108,347 |
| 30 | $43,219 | $76,123 | $174,494 |
| 40 | $70,400 | $149,745 | $452,593 |
Three observations from this table that change how most people think about long-term investing:
The growth curve accelerates dramatically. $10,000 at 7% gains only $9,672 in the first 10 years (less than its starting value), but gains $37,426 in the second 10 years and $56,448 in the third. Most of the total return arrives in the final decade.
Small rate differences matter enormously over time. The difference between 5% and 7% APY looks small (2 percentage points). Over 30 years, it's the difference between $43,000 and $76,000 — nearly 80% more. The difference between 7% and 10% is the difference between $76,000 and $174,000 — more than double.
Time is the dominant variable, not initial amount. This is the practical takeaway. A 25-year-old investing $10,000 once and never adding a dollar more reaches $149,000 by age 65. A 40-year-old doing the same reaches only $38,000 by age 65. Same money, different starting points, dramatically different outcomes.
Run your specific scenario through the Compound Interest Calculator — varying the time horizon, rate, and starting amount independently is the fastest way to internalize how each variable matters.
The Formula (And Why You Don't Really Need It)
The compound interest formula for a single lump-sum investment:
A = P × (1 + r)ⁿ
Where:
- A = final amount
- P = principal (initial investment)
- r = annual interest rate (as a decimal — 7% = 0.07)
- n = number of years
For $10,000 at 7% over 20 years: A = $10,000 × (1.07)²⁰ A = $10,000 × 3.8697 A = $38,697
The math is simple but doing it by hand is tedious. Almost no one in 2026 calculates compound interest manually; calculators and spreadsheets handle it instantly. What matters more than the formula is the intuition for how the variables interact:
- Doubling the time roughly squares the multiplier (1.07²⁰ ≈ 3.87, 1.07⁴⁰ ≈ 14.97 — almost 4× the multiplier for 2× the time)
- Each additional percentage point of return compounds, so 8% vs 7% over 30 years produces a 30% larger final amount, not just 14% more
The Rule of 72 Applied to $10,000
The Rule of 72 gives a fast mental approximation: dividing 72 by your annual return rate gives the approximate years required to double your money.
For $10,000:
| Rate | Years to $20,000 | Years to $40,000 | Years to $80,000 |
|---|---|---|---|
| 4% | ~18 years | ~36 years | ~54 years |
| 6% | ~12 years | ~24 years | ~36 years |
| 7% | ~10.3 years | ~20.6 years | ~30.9 years |
| 8% | ~9 years | ~18 years | ~27 years |
| 10% | ~7.2 years | ~14.4 years | ~21.6 years |
| 12% | ~6 years | ~12 years | ~18 years |
The doubling pattern is the key intuition for long-term investing. $10,000 at 7% doubles roughly every 10 years. So:
- Year 0: $10,000
- Year 10: $20,000
- Year 20: $40,000
- Year 30: $80,000
- Year 40: $160,000
The math compounds in halves of your timeline. A 40-year horizon gives you four doublings; a 20-year horizon gives you two. This is why early starts matter so much more than additional contributions — extending your timeline from 20 to 40 years multiplies your outcome by 4×, while doubling your starting investment multiplies it by only 2×.
What Drives the Acceleration?
The reason the curve accelerates is mechanical: each year's return is calculated on a larger base than the year before.
For $10,000 at 7%:
- Year 1: 7% of $10,000 = $700 added. New balance: $10,700.
- Year 2: 7% of $10,700 = $749 added. New balance: $11,449.
- Year 5: 7% of $13,108 = $918 added. New balance: $14,026.
- Year 10: 7% of $18,385 = $1,287 added. New balance: $19,672.
- Year 20: 7% of $36,165 = $2,532 added. New balance: $38,697.
- Year 30: 7% of $71,143 = $4,980 added. New balance: $76,123.
By year 30, the annual interest alone ($4,980) is nearly half the size of the original investment ($10,000). The growth is geometric, not linear — and the absolute dollar gains in the last decade are larger than the gains in the first two decades combined.
Where to Park $10,000 for Each Time Horizon
The right vehicle for a $10,000 investment depends on your time horizon and ability to handle volatility:
0-2 years (short term). High-yield savings account or short-term CD. 3.5-4.5% APY currently. Capital preservation is the priority; growth is secondary.
2-5 years (medium term). Mix of HYSA and short-to-medium duration bonds or balanced funds. 4-6% target return. Modest volatility tolerance.
5-10 years. Diversified portfolio with meaningful equity exposure (60-80% stocks, 20-40% bonds). 6-8% target return. Stomach for 10-15% drawdowns required.
10+ years. Predominantly equity (80-100% stocks for most investors). 7-10% target return. Stomach for 20-30%+ drawdowns required, with confidence to not sell during them.
30+ years. Equity-heavy, low-cost index funds (e.g., total US market, total international, S&P 500 index). 8-10% historical return. Long-term commitment.
For most readers with a $10,000 investment intended to grow for 20-40 years, the standard recommendation is a low-cost broad-market index fund — typically with annual fees under 0.10%. A fee-only CFP from letsmakeaplan.org can advise on the specific account types (Roth IRA, taxable brokerage, 401k) for your situation.
Inflation: The Hidden Drag
The numbers above are nominal returns — what your account statement will show. Inflation reduces the real (purchasing-power) value.
If long-term inflation averages 3% (historical US average), the real return on a 7% nominal portfolio is approximately 4%. The $76,123 at year 30 has the purchasing power of approximately $31,400 in today's dollars.
This sounds discouraging until you compare to the alternative: $10,000 sitting in cash for 30 years at no return has the purchasing power of approximately $4,100 in today's dollars (a 60% loss to inflation). Even after the inflation drag, the compound-interest investor is far ahead.
The practical implication: inflation makes "doing nothing" the worst option for long horizons. Even modest returns vastly outperform cash held outside any interest-bearing vehicle.
For a deeper look at how inflation eats purchasing power over decades, see Understanding Inflation and Your Money and use the Inflation Calculator to model specific scenarios.
What If You Add Monthly Contributions?
The biggest leap in outcome comes from adding regular contributions to the initial $10,000.
For $10,000 + $200/month at 7% over 30 years:
- $10,000 lump sum: grows to $76,123
- $200/month contributions: grow to $244,000
- Total: $320,123
For $10,000 + $500/month at 7% over 30 years:
- $10,000 lump sum: $76,123
- $500/month contributions: $610,000
- Total: $686,123
The monthly contributions, even at modest amounts, dominate the lump sum over long horizons. The takeaway: a single $10,000 investment is the beginning of a wealth-building strategy, not the whole strategy. Adding even $100-$200/month transforms the outcome.
See What Happens If You Invest $100 a Month for 30 Years? for the math on regular contributions alone.
Frequently Asked Questions
What rate of return should I assume? For long-term planning, 6-7% is a conservative middle estimate (real, after-inflation). 10% is the historical S&P nominal average, but unreliable for any specific period under 20 years. Always check with the Compound Interest Calculator at multiple rates to see the range.
Are these numbers before or after taxes? Before taxes. In a Roth IRA or Roth 401(k), withdrawals after 59½ are tax-free. In a traditional 401(k) or IRA, withdrawals are taxed as ordinary income. In a taxable brokerage, you owe capital gains tax (currently 15-20% for most investors) on the gains when you sell. Tax-advantaged accounts dramatically improve your effective return.
What if there's a market crash? There will be — multiple. The S&P 500's long-term ~10% average includes major crashes (2008, 2020, others), bear markets of -30 to -50%, and many smaller declines. The 7% real return is the result after those events, not in spite of them. The mistake to avoid is selling during a crash; staying invested through downturns is what produces the long-term average.
Should I dollar-cost average or invest the $10,000 all at once? Historical data favors lump-sum investing — putting the full $10,000 in immediately produces higher expected returns than spreading it over 6-12 months, because more time in the market matters more than timing. That said, dollar-cost averaging reduces the regret of investing right before a crash, which has its own behavioral value.
How does compounding inside a 401(k) differ? Tax-deferred growth: you don't pay taxes on dividends or capital gains each year, so the full balance keeps compounding. This produces meaningfully better long-term results than a taxable account at the same nominal return.
Is 7% realistic given current market conditions? The 7% real return is a long-term historical average — accurate for periods of 30+ years, unreliable for any shorter horizon. Recent decades have been higher than long-term averages; future returns could be lower. Planning at 6-7% real is generally considered conservative.
Next Steps
If you have a $10,000 investment opportunity (or are deciding whether to invest a $10,000 lump sum):
- Run the math at multiple rates and time horizons using the Compound Interest Calculator.
- Decide your time horizon honestly — 5 years is a fundamentally different question than 30 years.
- Match the vehicle to the horizon (HYSA short, broad equity index long).
The single most important lesson from compound interest math: time dominates everything else. A $10,000 investment 30 years from now is worth far less than the same $10,000 starting today. If the choice is "wait until I have more" vs "invest the $10,000 now," the math nearly always favors investing now. See The Power of Compound Interest Explained for the broader framework.
Run the numbers
Everything below came out of this site's own Savings Goal Calculator. The figures are not quoted from anywhere else: each row is one run of the same calculation the tool page performs, using August 2026 rules. Put the same inputs in and you will get the same output.
How the result moves with goal
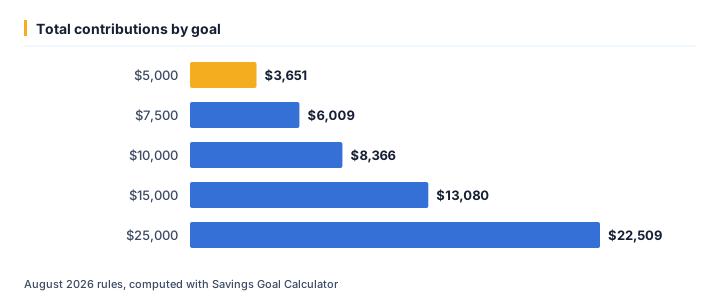
We ran 5 values of goal through the calculator and left every other input at its default. As of August 2026, the output was:
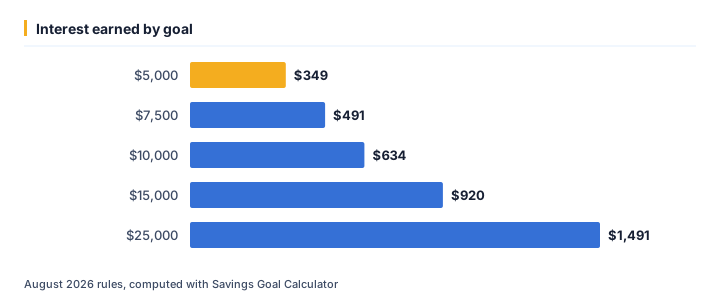
| Goal ($) | Total contributions ($) | Interest earned ($) | Needed ($) |
|---|---|---|---|
| 5,000 | 3,651.45 | 348.55 | 4,000 |
| 7,500 | 6,008.61 | 491.39 | 6,500 |
| 10,000 | 8,365.77 | 634.23 | 9,000 |
| 15,000 | 13,080.09 | 919.91 | 14,000 |
| 25,000 | 22,508.72 | 1,491.28 | 24,000 |
Running goal from $5,000 up to $25,000 moves total contributions from $3,651 to $22,509 — a spread of $18,857. That gap is the part a single headline rate never shows.
The same runs seen through interest earned
At $5,000, interest earned works out to $349; at $25,000 it is $1,491. Looking only at total contributions tends to understate how much the outcome shifts across that range.
One example, straight from the API
The middle row above (goal = $10,000) is not a rounded illustration — it is exactly what /api/v1/tools/savings-goal-calculator/calculate returns for that input, August 2026 rules:
{
    "tool": "savings-goal-calculator",
    "inputs": {
        "goal": 10000,
        "current": 1000,
        "years": 3,
        "rate": 4
    },
    "result": {
        "months": 36,
        "needed": 9000,
        "monthly_savings_required": 232.38,
        "total_contributions": 8365.77,
        "interest_earned": 634.23
    }
}
Assumptions behind these figures
| Input | Value |
|---|---|
| Goal | $10,000 |
| Current | $1,000 |
| Years | 3 years |
| Rate | 4% |
| As of | August 2026 |
| Method | identical to /tools/savings-goal-calculator |
Rates, thresholds and typical costs change over time; the numbers above are accurate as of August 2026, not a permanent guarantee. For your own situation, open the Savings Goal Calculator and enter your real numbers — the calculator runs the same code that produced every figure on this page.
Ready to crunch your numbers?
Open the Compound Interest Calculator and get an answer in seconds.
Editorial Team
We write plain-English money guides and build the free calculators behind them.