From 1970 to 2026, the US dollar lost approximately 88% of its purchasing power. What cost $1 in 1970 costs roughly $8.30 in 2026 — a useful baseline for understanding why inflation matters more to long-term wealth than most savers realize.
Over the 56 years from 1970 to 2026, US prices have risen approximately 730% — meaning what cost $1 in 1970 costs roughly $8.30 in 2026. The dollar has lost about 88% of its purchasing power over the period. This is the kind of long-horizon math that doesn't fit on a single bank statement but shapes every retirement plan, every long-term savings goal, and every "real return" calculation.
This guide walks through what 1970-to-2026 inflation actually looks like decade by decade, the events that drove the major surges, and how to think about the next 56 years from a planning perspective.
The Quick Answer
Using the US Consumer Price Index for All Urban Consumers (CPI-U):
| Item Costing $1 in... | Equivalent Cost in 2026 |
|---|---|
| 1970 | ~$8.30 |
| 1975 | ~$5.95 |
| 1980 | ~$3.95 |
| 1985 | ~$3.00 |
| 1990 | ~$2.46 |
| 1995 | ~$2.10 |
| 2000 | ~$1.85 |
| 2005 | ~$1.62 |
| 2010 | ~$1.44 |
| 2015 | ~$1.32 |
| 2020 | ~$1.24 |
| 2025 | ~$1.03 |
Translation: $100 in 1970 has the buying power of about $830 in 2026. $100 in 2000 has the buying power of about $185 in 2026.
For specific year-to-year calculations, use the Inflation Calculator — it handles any pair of years from 1913 onward using BLS CPI data.
Decade by Decade: What Drove Inflation
The full 56-year period covers six distinct inflation regimes. Understanding which decades had which experience helps explain why the cumulative number is so large.
1970s: The High-Inflation Decade
Annual inflation averaged roughly 7% across the 1970s, with peaks above 13% in 1979-1980. Cumulative inflation over the decade was approximately 105%, more than doubling US prices in 10 years.
The drivers:
The end of the Bretton Woods system (1971). Nixon ended the dollar's convertibility to gold, transitioning the US to a pure fiat currency. The decoupling from gold removed one constraint on monetary expansion.
The 1973 oil embargo and 1979 oil crisis. OPEC restricted oil supply, sending energy prices up sharply. Energy is an input to almost every other consumer good, so the oil shocks rippled through the entire price level.
Loose monetary policy through the 1970s. The Federal Reserve, under Arthur Burns, was slower to raise rates than the inflation environment required. By the end of the decade, inflation expectations had become entrenched — workers demanded higher wages to keep pace, employers passed costs through to prices, which justified the next round of wage demands.
The Volcker shock (1979-1982). Paul Volcker, appointed Fed Chair in 1979, raised interest rates aggressively (federal funds rate peaked near 20% in 1981) to break inflation expectations. The strategy worked but at the cost of a sharp recession.
1980s: The Disinflation Decade
Inflation fell from double digits early in the decade to around 4-5% by the late 1980s. Cumulative inflation over the decade was approximately 65%.
The drivers:
Volcker's monetary tightening. The aggressive rate hikes of 1979-1982 broke inflation expectations and slowed the wage-price spiral.
Oil prices stabilizing and then falling. After the 1979 peak, oil prices declined through the mid-1980s, removing one of the major cost-push drivers.
Restored credibility of the Federal Reserve. Once markets and workers believed the Fed would tolerate recession to fight inflation, the inflation expectations component of actual inflation receded.
1990s-2000s: The "Great Moderation"
Inflation averaged 2-3% annually across the 1990s and 2000s. Cumulative inflation over the 20-year period was approximately 65%.
The drivers:
Globalization and trade liberalization. China's entry into the WTO (2001), NAFTA (1994), and broader trade integration brought low-cost manufactured goods to US consumers, suppressing the prices of consumer goods substantially.
Productivity gains from information technology. The personal computer revolution and internet expansion increased productivity, allowing prices to rise less than they otherwise would have.
Credible inflation targeting. Central banks worldwide (the Fed implicitly, others explicitly) adopted ~2% inflation targets. Markets and workers came to expect 2% inflation, which became self-fulfilling.
This 20-year period was anomalously calm by historical standards. Many economists and consumers came to believe high inflation was a problem of the past — a belief that 2021-2023 sharply challenged.
2010s: Post-Crisis Low Inflation
Inflation averaged about 1.8% annually across the 2010s. Cumulative inflation over the decade was approximately 18%.
The drivers:
Lingering effects of the 2008-2009 financial crisis. Weak demand, high unemployment, and deflationary pressures kept inflation below the Fed's 2% target for most of the decade.
Continued globalization. Goods imports kept pressure off consumer prices.
Technology disruption of pricing. E-commerce, transparent pricing, and increased competition in many consumer categories further suppressed price increases.
For most of this decade, the Fed's concern was that inflation was too low (deflation risk), not too high.
2020s: The Inflation Surprise
Inflation accelerated sharply in 2021-2022, peaking around 9% (the highest since the early 1980s) before moderating. Cumulative inflation from 2020 to 2026 has been approximately 24%.
The drivers:
Pandemic-related supply disruptions (2020-2022). Shipping, manufacturing, labor markets, and energy supply all faced significant disruptions. Production capacity and inventory normalized slowly.
Massive fiscal and monetary response to the pandemic. Direct stimulus payments, expanded unemployment benefits, the PPP program, and near-zero interest rates injected substantial demand into the economy at a moment when supply was constrained.
Energy market disruption from the Russia-Ukraine war (2022). Sanctions on Russian oil and gas, and the broader European energy crisis, pushed energy prices sharply higher in 2022.
Tight labor markets and wage growth. Workforce changes during and after the pandemic produced sustained labor shortages in several sectors, pushing wages (and ultimately consumer prices) higher.
By 2023-2024, the Fed had raised rates aggressively (from near zero to over 5%) and inflation had moderated toward 3-4%. The full unwinding to 2% has been slower and bumpier than many forecasters expected.
What 88% Cumulative Inflation Means in Practice
A few concrete illustrations of how the 1970-to-2026 inflation has reshaped US prices:
A new car. Average new car price in 1970: ~$3,500. Average new car price in 2026: ~$48,000. The nominal increase is 14×, well above the 8.3× general CPI multiplier — partly because cars are now larger and more feature-rich, partly because cars have outpaced general inflation.
A gallon of gasoline. Average gas price in 1970: ~$0.36. Average gas price in 2026: ~$3.30 (varies sharply by region and year). Nominal increase: 9.2× — slightly above the general CPI multiplier.
A median US home. Median sale price in 1970: ~$23,000. Median sale price in 2026: ~$425,000. Nominal increase: 18.5×. Housing has substantially outpaced general inflation, particularly in coastal and high-growth metros.
Postage stamp (first-class). 1970: $0.06. 2026: $0.73. Nominal increase: 12.2×.
A movie ticket. 1970: $1.55. 2026: $12-$15 depending on city. Nominal increase: 8-10×.
A McDonald's Big Mac. 1970: $0.65. 2026: $6.50-$8. Nominal increase: 10-12×.
The pattern: many consumer prices have risen at roughly the general inflation rate or slightly above it. Items with significant labor content (services, healthcare, education) have generally outpaced inflation. Items with significant technology content (electronics, communications) have generally lagged inflation, and in some cases have actually fallen in price.
What This Means for Long-Term Savers
The 1970-to-2026 inflation history has three practical implications for personal finance planning:
Cash is the worst long-term store of value. $10,000 hidden in a mattress in 1970 has the purchasing power of approximately $1,200 in 2026. The 88% loss is invisible in absolute terms (you still have $10,000) and devastating in purchasing-power terms.
Even "safe" investments need to beat inflation. A savings account paying 1% APY in a 3% inflation environment loses 2% of real value annually. Over 30 years, the principal loses approximately 45% of purchasing power despite the nominal interest. High-yield savings (currently 3.5-4.5% APY) keeps pace; longer-term investments (stocks, real estate) historically beat inflation by meaningful margins.
Retirement planning must assume inflation continues. A retirement income that seems comfortable today will be inadequate in 30 years if it's not indexed. Social Security is partially inflation-adjusted (annual COLA based on CPI-W). Private pensions often are not. Investment-based retirement income (e.g., 4% withdrawal from a portfolio) needs to come from a portfolio that grows faster than inflation over the retirement period.
See Understanding Inflation and Your Money for the practical framework, and Inflation Update 2026: How to Protect Your Money for the current environment specifically.
Will the Next 56 Years Be Like the Last 56?
The honest answer: nobody knows. But a few observations:
The historical US long-term average inflation is approximately 3%. 1970-2026 was somewhat above average due to the 1970s; 2010-2019 was below average. Over very long periods, 3% is the rough planning anchor most economists use.
Central bank inflation-targeting is now mainstream. The Fed and most major central banks explicitly target ~2% inflation. This is a constraint that didn't exist in the 1970s. If central banks remain credible and politically independent, 2-3% average inflation is more likely than another 7%-average decade.
Technological deflation continues in certain categories. Electronics, communications, and software continue to fall in price (or hold price while improving). This offset against general inflation is structural.
New inflation pressures could emerge. Aging demographics (fewer workers, more retirees), de-globalization (reshoring of manufacturing), climate-related cost increases, and ongoing geopolitical disruption could all push inflation higher than the historical average.
A reasonable planning assumption for the next 30 years: 2.5-3.5% annual inflation, with the understanding that any individual year could be much higher or lower. The Inflation Calculator projects forward based on user-input assumptions if you want to test different scenarios.
Frequently Asked Questions
Is the CPI an accurate measure of "real" inflation? The Consumer Price Index is the most widely used inflation measure, but it has known limitations. It captures a basket of goods that may not match your personal spending pattern. Housing, healthcare, and education prices may rise faster than the CPI suggests for households with significant exposure to those categories. The PCE (Personal Consumption Expenditures) index, which the Fed prefers, often shows slightly different numbers. For long-term planning, CPI is a reasonable approximation.
Why is the dollar's purchasing power going down? Because the supply of dollars grows faster than the supply of goods and services. When more dollars chase the same amount of goods, each dollar buys less. This is the basic mechanism behind nearly all inflation.
Has the US ever had deflation? Yes, several times — most notably during the Great Depression (1929-1933), when prices fell roughly 25%. Deflation is generally worse than mild inflation because it discourages spending and investment (everyone waits for prices to fall further). The Fed's 2% inflation target is specifically designed to keep the economy safely above the deflation line.
Does inflation affect everyone equally? No. Inflation hits households with high spending on essentials (food, energy, healthcare) harder than households with high spending on technology or services that have deflated. Lower-income households generally feel inflation more than higher-income households. Households with fixed incomes (pensions, retirees on Social Security) generally lose ground; households with wage growth that keeps pace generally maintain purchasing power.
What about deflation in technology? Electronics and communications have fallen in price (or held price while dramatically improving in capability) over the entire 1970-2026 period. A 1970 long-distance phone call was hugely expensive; in 2026, video calls are functionally free. Personal computers, smartphones, internet bandwidth, software — all have deflated or held flat. This is one of the major offsets against general inflation, particularly for tech-heavy household spending.
What protects best against inflation? Over very long horizons, broad equity ownership (stocks) has been the most reliable inflation hedge. Real estate has historically outpaced inflation. Treasury Inflation-Protected Securities (TIPS) provide direct inflation indexation. Cash held in inflation-equivalent or higher-yielding instruments at minimum keeps pace. The worst inflation hedge is uninvested cash.
Next Steps
For specific dollar-amount-to-equivalent calculations between any two years, use the Inflation Calculator — it handles every year from 1913 to present.
For the conceptual framework of how inflation interacts with your savings and investments, see Understanding Inflation and Your Money. For current-year specifics on protecting purchasing power, see Inflation Update 2026: How to Protect Your Money.
The 56-year history from 1970 to 2026 is a useful baseline for thinking about the next 56 years. The exact pattern won't repeat, but the underlying force — gradually rising prices, slow loss of purchasing power, the dominance of long-term real (not nominal) returns — almost certainly will.
Run the numbers
Everything below came out of this site's own Compound Interest Calculator. The figures are not quoted from anywhere else: each row is one run of the same calculation the tool page performs, using August 2026 rules. Put the same inputs in and you will get the same output.
How the result moves with principal
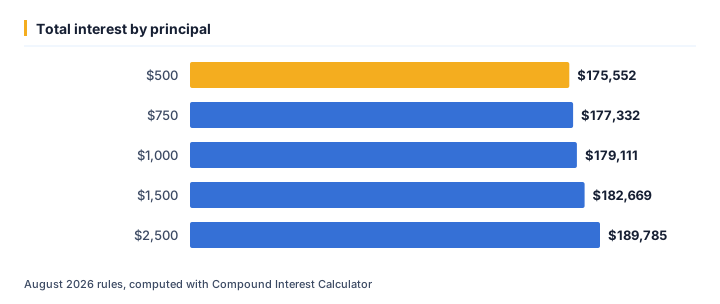
We ran 5 values of principal through the calculator and left every other input at its default. As of August 2026, the output was:
| Principal ($) | Total interest ($) | Total contributed ($) | Future value ($) |
|---|---|---|---|
| 500 | 175,552.45 | 72,500 | 248,052.45 |
| 750 | 177,331.57 | 72,750 | 250,081.57 |
| 1,000 | 179,110.7 | 73,000 | 252,110.7 |
| 1,500 | 182,668.95 | 73,500 | 256,168.95 |
| 2,500 | 189,785.44 | 74,500 | 264,285.44 |
Running principal from $500 up to $2,500 moves total interest from $175,552 to $189,785 — a spread of $14,233. That gap is the part a single headline rate never shows.
The same runs seen through total contributed
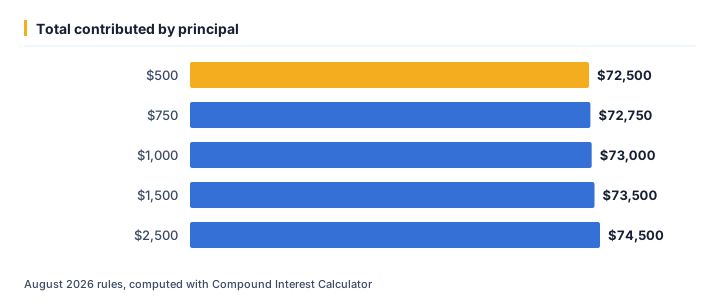
At $500, total contributed works out to $72,500; at $2,500 it is $74,500. Looking only at total interest tends to understate how much the outcome shifts across that range.
One example, straight from the API
The middle row above (principal = $1,000) is not a rounded illustration — it is exactly what /api/v1/tools/compound-interest-calculator/calculate returns for that input, August 2026 rules:
{
    "tool": "compound-interest-calculator",
    "inputs": {
        "principal": 1000,
        "monthly": 200,
        "rate": 7,
        "years": 30,
        "freq": 12
    },
    "result": {
        "future_value": 252110.7,
        "total_contributed": 73000,
        "total_interest": 179110.7,
        "growth_multiple": 3.45
    }
}
Assumptions behind these figures
| Input | Value |
|---|---|
| Principal | $1,000 |
| Monthly | $200 |
| Rate | 7% |
| Years | 30 years |
| Freq | $12 |
| As of | August 2026 |
| Method | identical to /tools/compound-interest-calculator |
Rates, thresholds and typical costs change over time; the numbers above are accurate as of August 2026, not a permanent guarantee. For your own situation, open the Compound Interest Calculator and enter your real numbers — the calculator runs the same code that produced every figure on this page.
Ready to crunch your numbers?
Open the Compound Interest Calculator and get an answer in seconds.
Editorial Team
We write plain-English money guides and build the free calculators behind them.