Investing $100 a month for 30 years at a 7% annual return produces about $122,000 — meaningfully more than the $36,000 in contributions alone. The math reveals one of the most underrated mechanics in personal finance: small consistent contributions over long horizons quietly become large balances.
One hundred dollars a month is a small enough amount that almost anyone earning a US median income can find it without changing their lifestyle. Thirty years is a long enough horizon that most readers in their 20s and 30s have it ahead of them, whether they think about it or not. The combination of "small monthly amount" and "long time horizon" produces one of the most consistently surprising results in personal finance.
This guide shows exactly what $100 a month becomes at the most commonly cited investment return rates, why the final decade contains most of the growth, and how this single decision compares to the more dramatic-feeling alternatives.
The Quick Answer
$100/month for 30 years, at three common annual return rates:
| Annual Return | Total Contributed | Final Balance | Interest Earned |
|---|---|---|---|
| 4% (high-yield savings) | $36,000 | $69,400 | $33,400 |
| 5% (conservative balanced) | $36,000 | $83,225 | $47,225 |
| 7% (typical real return) | $36,000 | $121,997 | $85,997 |
| 8% (slightly above average) | $36,000 | $149,036 | $113,036 |
| 10% (S&P historical nominal) | $36,000 | $227,933 | $191,933 |
The most striking number is in the 10% column: $36,000 of contributions over three decades has become $227,933 — interest alone is more than 5× the original contributions. Even at the more conservative 7% rate, interest exceeds contributions by 2.4×.
For specific calculations at different time horizons and rates, use the Compound Interest Calculator.
The Year-by-Year Curve
The mechanics of how $100/month becomes $122,000 (at 7%) are worth tracing year by year, because the shape of the curve is the entire lesson.
| Year | Contributions So Far | Total Balance | Balance from Interest |
|---|---|---|---|
| 1 | $1,200 | $1,243 | $43 |
| 5 | $6,000 | $7,201 | $1,201 |
| 10 | $12,000 | $17,409 | $5,409 |
| 15 | $18,000 | $31,696 | $13,696 |
| 20 | $24,000 | $51,716 | $27,716 |
| 25 | $30,000 | $79,755 | $49,755 |
| 30 | $36,000 | $121,997 | $85,997 |
Three patterns emerge from this table.
The first decade looks unimpressive. After 10 years of $100 monthly contributions, the balance is $17,409 — only 14% of the eventual 30-year total. This is the reason so many people abandon long-term plans: the early years feel like nothing is happening.
The second decade gains momentum. Years 11-20 add $34,307 to the balance, despite only $12,000 of new contributions during that time. Interest is starting to compound on a meaningfully larger base.
The third decade is where the magic lives. Years 21-30 add $70,281 to the balance — more than the first 20 years combined — on the same $12,000 of new contributions. The interest-on-interest effect dominates.
This is what compounding actually looks like in practice: a slow, almost-discouraging early phase followed by an accelerating middle phase and a dramatically rewarding final phase. The discipline test is the first decade; the math reward arrives in the third.
Why the Total Beats the Sum of Contributions
The $36,000 contributed over 30 years becomes $122,000 — an extra $86,000 of growth on top of the principal. Where does the extra money come from?
The mechanical answer: each year's contributions earn returns for the remaining years of the time horizon. The $100 you invest in year 1 earns returns for all 30 years. The $100 in year 15 earns returns for 15 years. The $100 in year 29 earns returns for just one year. The earliest contributions do the most work.
A specific example. The $100 invested in month 1 of year 1, at 7% annual return, grows to:
- Year 5: $140
- Year 10: $197
- Year 15: $276
- Year 20: $387
- Year 25: $543
- Year 30: $761
That single $100 contribution, made early enough, becomes $761 by year 30. The same $100 invested in year 29 grows to just $107. Same money, different timing, dramatically different result.
This is the math reason the personal-finance advice to "start early" carries so much weight. The first year's $100 contributions do 7× the work of the final year's $100 contributions, simply because they have 29 more years to compound.
Comparing Time Horizons
What changes if the time horizon is shorter or longer?
| Time Horizon | At 7% Annual Return |
|---|---|
| 10 years | $17,409 |
| 15 years | $31,696 |
| 20 years | $51,716 |
| 25 years | $79,755 |
| 30 years | $121,997 |
| 35 years | $181,156 |
| 40 years | $264,012 |
| 45 years | $379,956 |
A 25-year-old who invests $100/month for 45 years (until age 70) ends up with $379,956 — more than 3× what a 30-year horizon produces. The difference between starting at age 25 and starting at age 35 is $120,000 of final balance, for the same $100/month effort and 35 years vs 45 years of contribution.
This is the case for starting as early as possible, not for waiting "until you can afford to invest more." Time is the dominant variable.
What If You Increase to $200, $500, or $1,000 a Month?
The relationship is linear within the contribution variable: doubling contributions doubles the final balance.
For 30 years at 7% annual return:
| Monthly Contribution | Total Contributed | Final Balance |
|---|---|---|
| $50 | $18,000 | $60,998 |
| $100 | $36,000 | $121,997 |
| $200 | $72,000 | $243,994 |
| $300 | $108,000 | $365,991 |
| $500 | $180,000 | $609,985 |
| $750 | $270,000 | $914,978 |
| $1,000 | $360,000 | $1,219,971 |
The headline number is $1,000/month for 30 years at 7%: $1.22 million. That's the rough mathematical retirement target for a typical US household using only contributions and market growth.
For most readers, the practical path is to start at $100-$200/month (whatever is achievable today), then ratchet up by $50-$100/month each year as income grows. By year 10, you might be at $500/month; by year 20, at $1,000/month. The final balance from this kind of dialed-up plan typically lands at $700,000-$1.5M at age 65, even starting from very modest contributions.
Real vs Nominal Returns
The numbers above are nominal returns — what your account statement will show. Inflation reduces the real (purchasing-power) value over time.
If long-term inflation averages 3% (historical US average), the real return on a 7% nominal portfolio is approximately 4%. The $122,000 at year 30 has the purchasing power of approximately $50,000 in today's dollars.
This sounds discouraging until you compare to the alternative: $100/month sitting in cash for 30 years (zero return) has the nominal value of $36,000 and the real value of approximately $15,000 in today's dollars after inflation. The compound investor is far ahead.
For comparison across scenarios with different inflation assumptions, use the Inflation Calculator alongside the Compound Interest Calculator.
Where to Invest the $100
For a 30-year horizon, the standard recommendation across mainstream personal-finance frameworks is a low-cost broad-market index fund (e.g., a total US stock market index, or an S&P 500 index fund) held inside a tax-advantaged account.
Tax-advantaged options for $100/month:
- Roth IRA. Annual limit: $7,500 in 2026 ($625/month maximum). Contributions are after-tax; withdrawals after age 59½ are tax-free. For most under-40 readers, this is the highest-recommended starting place.
- Traditional 401(k) or 403(b) at work. If your employer offers a match, contribute at least enough to capture the full match — it's free money. The match itself often turns $100/month into $150-$200/month into the account.
- Traditional IRA. Same annual limit as Roth IRA, but contributions are pre-tax (deduction now, taxed at withdrawal). Sometimes the right choice depending on current vs expected future tax brackets.
- Taxable brokerage. No tax advantages but no contribution limits. Use after the tax-advantaged accounts are filled.
A fee-only CFP from letsmakeaplan.org can advise on the specific account type that fits your situation.
Fund selection for the long term:
Most of the personal-finance evidence points to broad, low-cost index funds (annual fees under 0.10%) outperforming actively managed funds over multi-decade periods. The choices most commonly recommended:
- Total US stock market index (e.g., VTI, FZROX, equivalent at Schwab/Fidelity)
- S&P 500 index (e.g., VOO, SWPPX, FXAIX)
- Total international stock index (e.g., VXUS, FZILX)
- A 3-fund portfolio (US total + international + bond index in age-appropriate ratio)
What Stops This From Working
A few honest scenarios where the math is more complicated than the simple compounding picture:
Stopping early. $100/month for 30 years at 7% = $122,000. $100/month for 20 years at 7% then stop and let it ride for 10 years = $103,000. The "set it and forget it" path beats "I'll come back to it" in nearly every case.
Selling during a crash. $100/month invested faithfully through 2008-2009 produced spectacular results once the recovery completed. $100/month invested through 2007, then sold at the bottom of 2008, then started again in 2010 produced losses. Behavior matters as much as math.
High fees. A fund with a 1% annual expense ratio costs you about 25% of your final balance over 30 years compared to a 0.05% fund. Same contributions, same nominal returns, dramatically different outcomes. Low-cost index funds are the standard recommendation for this reason.
Inflation in retirement. A $122,000 nominal balance at year 30 has purchasing power of $50,000 in today's dollars. This is meaningful but not enough to retire on alone. $100/month is a foundation, not a complete retirement plan.
Frequently Asked Questions
What if I can only invest $50/month? Start there. $50/month for 30 years at 7% = $61,000. Smaller than $122,000 but vastly larger than $0. Once the habit is in place, ratchet up by $25/month every January for several years.
What if I want to invest $200/month instead? At 7% over 30 years: $243,994. The math is linear within the contribution rate — twice the contribution produces twice the balance.
Should the $100/month be in stocks or bonds? For a 30-year horizon, the standard advice is predominantly stocks (80-100% equity for most under-50 investors), shifting toward bonds gradually as retirement approaches. The historical case for long-horizon equity exposure is strong; the volatility tolerance required is real.
What rate of return should I assume? For planning, 6-7% real (after-inflation) is the conservative middle. 10% nominal is the historical S&P average. Use the Compound Interest Calculator at multiple rates to see the range of outcomes.
Is this enough to retire on? $122,000 alone is not a complete retirement, but it's a substantial foundation. Combined with Social Security, employer retirement contributions, and home equity, $100/month can be part of a workable retirement strategy. Most retirement plans target $500-$1,500/month of contributions over a working lifetime; $100 is the floor.
What if I can't contribute every month? Skipping a month or two during cash crunches has small impact in the long run. The behavioral risk is using one skipped month as a reason to stop entirely — the difference between "skip one month" and "stop investing" is enormous.
Next Steps
If you do nothing else this week:
- Open a Roth IRA at a low-cost broker (Vanguard, Fidelity, Schwab) if you don't have one. Setup takes under 30 minutes.
- Set up an automatic $100 monthly contribution from your checking account.
- Choose a single broad-market index fund (total US market or S&P 500). Don't overthink the fund selection — the discipline of consistent contributions matters more than the specific fund choice.
The $100-a-month, 30-year investment is the most accessible long-term wealth-building strategy in US personal finance. The barrier is not the money; it's starting. Run the Compound Interest Calculator on a few different scenarios to find one that matches your timeline, then automate the contributions and let the math work for the next three decades.
Run the numbers
Everything below came out of this site's own Savings Goal Calculator. The figures are not quoted from anywhere else: each row is one run of the same calculation the tool page performs, using August 2026 rules. Put the same inputs in and you will get the same output.
How the result moves with goal
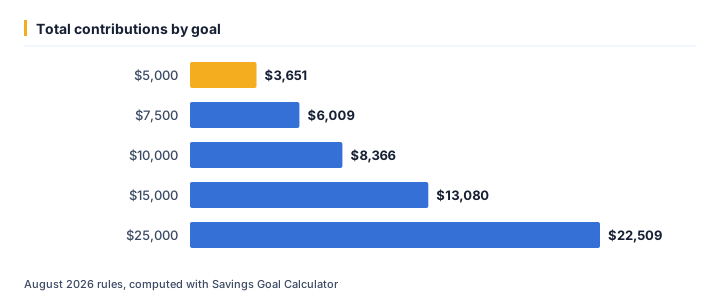
We ran 5 values of goal through the calculator and left every other input at its default. As of August 2026, the output was:
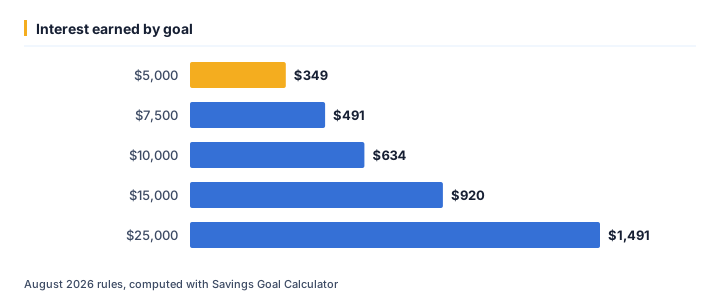
| Goal ($) | Total contributions ($) | Interest earned ($) | Needed ($) |
|---|---|---|---|
| 5,000 | 3,651.45 | 348.55 | 4,000 |
| 7,500 | 6,008.61 | 491.39 | 6,500 |
| 10,000 | 8,365.77 | 634.23 | 9,000 |
| 15,000 | 13,080.09 | 919.91 | 14,000 |
| 25,000 | 22,508.72 | 1,491.28 | 24,000 |
Running goal from $5,000 up to $25,000 moves total contributions from $3,651 to $22,509 — a spread of $18,857. That gap is the part a single headline rate never shows.
The same runs seen through interest earned
At $5,000, interest earned works out to $349; at $25,000 it is $1,491. Looking only at total contributions tends to understate how much the outcome shifts across that range.
One example, straight from the API
The middle row above (goal = $10,000) is not a rounded illustration — it is exactly what /api/v1/tools/savings-goal-calculator/calculate returns for that input, August 2026 rules:
{
    "tool": "savings-goal-calculator",
    "inputs": {
        "goal": 10000,
        "current": 1000,
        "years": 3,
        "rate": 4
    },
    "result": {
        "months": 36,
        "needed": 9000,
        "monthly_savings_required": 232.38,
        "total_contributions": 8365.77,
        "interest_earned": 634.23
    }
}
Assumptions behind these figures
| Input | Value |
|---|---|
| Goal | $10,000 |
| Current | $1,000 |
| Years | 3 years |
| Rate | 4% |
| As of | August 2026 |
| Method | identical to /tools/savings-goal-calculator |
Rates, thresholds and typical costs change over time; the numbers above are accurate as of August 2026, not a permanent guarantee. For your own situation, open the Savings Goal Calculator and enter your real numbers — the calculator runs the same code that produced every figure on this page.
Ready to crunch your numbers?
Open the Compound Interest Calculator and get an answer in seconds.
Editorial Team
We write plain-English money guides and build the free calculators behind them.