Compound interest is the single most important piece of math in any adult's financial life — and almost nobody truly internalizes how dramatic the late-stage curve becomes. Here is what it looks like with real US dollars.
Albert Einstein, the legend goes, called compound interest "the eighth wonder of the world." There is no documented evidence he actually said it — but the line stuck for a hundred years because the math feels miraculous when you encounter it the first time. A modest monthly contribution, left alone for a few decades, turns into a number that does not look like it could possibly belong to the same household.
This guide makes the math concrete using real US-dollar examples, explains exactly why the curve bends so dramatically in years 25–40, shows the eye-watering cost of waiting just one year to start, and walks through how to put compound interest to work in your life with the simplest possible setup.
What Compound Interest Actually Is
Simple interest is what you earn on the original principal only. Put $1,000 in an account paying 5% simple interest annually and you earn $50 a year, forever. After 30 years, the balance is $1,000 + ($50 × 30) = $2,500. Reasonable, predictable, not life-changing.
Compound interest is what you earn on the original principal plus on all the interest you have already earned. Same $1,000 at 5% compound annual interest grows to:
- Year 1: $1,050.00
- Year 5: $1,276.28
- Year 10: $1,628.89
- Year 20: $2,653.30
- Year 30: $4,321.94
- Year 40: $7,039.99
That same $1,000, with no additional contributions, grows to $7,040 over 40 years purely from interest compounding on itself. The simple interest version would be $3,000. The difference — $4,040 — is what is sometimes called the compounding "snowball": interest earning interest, earning interest, earning interest, for four decades.
Now imagine the same setup with $300 added each month rather than a one-time $1,000. At 7% annual return (a realistic long-run real return for a diversified US stock portfolio), the math is genuinely startling.
The 40-Year Curve: Why It Bends
Here is what $300 a month at a 7% annual return looks like at five-year intervals:
| Years invested | Total contributed | Final balance |
|---|---|---|
| 5 | $18,000 | $21,521 |
| 10 | $36,000 | $51,968 |
| 15 | $54,000 | $95,070 |
| 20 | $72,000 | $156,062 |
| 25 | $90,000 | $242,341 |
| 30 | $108,000 | $364,396 |
| 35 | $126,000 | $537,099 |
| 40 | $144,000 | $781,371 |
Two things to notice in this table.
First, the curve is not a straight line. From years 0 to 10, you contribute $36,000 and end with $52,000 — a $16,000 gain. From years 30 to 40, you contribute the same $36,000 and end with $417,000 more than you started that decade with. The same $36,000 ten-year contribution produced a ~26× larger absolute gain in the last decade versus the first. That is compounding.
Second, contributions stop dominating early on. In year 5, of the $21,521 balance, contributions are $18,000 (84%) and growth is $3,521 (16%). In year 40, of the $781,371 balance, contributions are $144,000 (18%) and growth is $637,371 (82%). At some point — typically year 15–18 for most realistic return assumptions — growth contributions exceed your dollar contributions for the rest of the run. After that crossover, your own deposits matter less than what the existing balance is doing on its own.
This is the most important insight in compound interest: time, not contribution size, does most of the heavy lifting. A late starter with twice the contribution rarely catches up to an early starter with half the contribution.
The Cost of Waiting One Year
Knowing this, the marginal cost of delaying a decision becomes obvious. Take two people, both planning to retire at 65, both contributing $300 a month at 7%:
- Person A starts at age 25, runs through 65 (40 years). Ends with $781,371.
- Person B starts at age 26, runs through 65 (39 years). Ends with $726,514.
One year of delay = $54,857 of future wealth lost. At minimum-wage hourly rates, that is the equivalent of ~7,000 hours of work you have to do later because you did not start the contribution this year.
Stretch the delay further:
- Start at 30 (35 years): $537,099 — five years of delay costs $244,272.
- Start at 35 (30 years): $364,396 — ten years of delay costs $416,975.
- Start at 45 (20 years): $156,062 — twenty years of delay costs $625,309.
The cost of waiting is not linear. Each additional year of delay costs more than the last because you are losing the years when your existing balance would have been doing the heaviest lifting on its own.
Plug your own age, planned retirement, monthly contribution, and expected return into the Compound Interest Calculator. The visceral feeling of seeing "wait one more year" cost tens of thousands of dollars is what shifts more people from saying "I should start investing" to actually opening the account this week.
Real Returns vs. Nominal Returns
The 7% figure above is a real annual return — i.e., after subtracting inflation. The historical nominal return on US stocks (S&P 500) has been closer to 10% per year, with inflation averaging around 3%, yielding a real return near 7%.
Why real returns matter: the $781,371 in the 40-year example is in today's dollars (purchasing power equivalent), not in 40-year nominal dollars. Forty years of 3% inflation roughly triples nominal prices, so the nominal future-dollar balance would be much higher — but the purchasing power is what matters for retirement planning.
Common return assumptions for personal finance planning:
- Diversified stock portfolio (S&P 500 or total US market): ~7% real long-run.
- 60/40 stock/bond portfolio: ~5% real long-run.
- High-yield savings account or short Treasury: ~0–1% real (sometimes negative in inflationary periods).
- Speculative single-stock or crypto: wide variance; planning assumptions inappropriate.
Use 7% if your monthly contributions go into a low-cost, broadly diversified equity index fund. Use 5% if you hold a more conservative balanced portfolio. Use lower numbers only if you have a specific reason — and never use the past year's market return as your assumption. Personal finance planning runs on decade-long averages, not 12-month windows.
Three People, One Lesson
The classic compound interest case study, made concrete. All three earn the same 7% real annual return.
Alex opens a Roth IRA at age 25, contributes $300 a month for 10 years, then stops contributing entirely. Total dollars in: $36,000. Final balance at 65: $372,000.
Blake waits until 35 to start, then contributes $300 a month for 30 straight years until 65. Total dollars in: $108,000. Final balance at 65: $367,000.
Casey starts at 25 and never stops, contributing $300 a month for the full 40 years. Total dollars in: $144,000. Final balance at 65: $781,000.
Notice what happens between Alex and Blake. Alex put in $36,000 of contributions and ended with $372,000. Blake put in three times as much money ($108,000) and ended with almost exactly the same balance ($367,000). The advantage of starting ten years earlier roughly canceled out the disadvantage of contributing only one-third the dollars.
Casey, who combined the early start with the long duration, ended up with roughly twice as much as either of the other two — for an effective contribution of just $300 a month. No special skill. No insider strategy. Just time.
The lesson is brutally simple: start now, even small, and never stop.
What Drives Compound Interest in Practice
Three levers move the final balance. Optimizing each one is the entire game.
Time
The most important lever and the one you have least control over after the fact. The 25-year-old reading this article will outperform the 35-year-old reading it, all else equal, by a factor that no investment strategy can offset. If you are 25, your single biggest financial advantage is the next 10 years — use them.
If you are older, the lesson is the same direction even if the magnitude is smaller: every year you delay further is the most expensive year, because it is the most distant year from your retirement and therefore contributes most to the back-end of the compounding curve.
Contribution amount
Within the constraints of your income, contribute more. Specific tactics that move this lever:
- Capture the full employer 401(k) match. A 50–100% instant return on contributed dollars.
- Bank every raise. Increase your contribution percentage automatically every time gross pay rises. Most workplace 401(k) platforms support auto-escalation; check the box.
- Direct tax refunds and bonuses straight into investments. Money you never see in checking is money you never miss.
- Max out tax-advantaged accounts first. 401(k), then HSA if available, then Roth IRA, then back to 401(k) up to the annual limit, then taxable brokerage. Tax-advantaged accounts compound without annual tax drag.
Rate of return
The lever with the most uncertainty and the most temptation to over-optimize. For most personal finance scenarios:
- A 1% improvement in long-run returns (say, 7% → 8%) increases a 40-year compounded balance by roughly 50%.
- The reliable way to capture more return is not stock picking or market timing. Decades of data show 80–90% of active traders underperform a basic index fund.
- The reliable way to capture more return is lower expense ratios. A fund with a 1.0% expense ratio underperforms an equivalent fund with a 0.1% expense ratio by exactly 0.9% per year — and over 40 years, that 0.9% compounds to a ~30% smaller balance. Use index funds.
The honest summary: in long-run real terms, equities have returned around 7%. Bonds have returned around 2%. Most personal finance success is about staying invested in a broadly diversified equity portfolio for long enough, not about finding a portfolio that beats 7%.
Where to Put the Money
The optimal place for compounding dollars depends on tax treatment and time horizon. In rough order of priority for most US workers:
- 401(k) up to the employer match. Free money, immediate ~50–100% return, plus tax deferral on the contribution and decades of tax-free compounding inside the account.
- HSA (if available with a high-deductible health plan). Triple tax advantage — pre-tax contribution, tax-free growth, tax-free withdrawal for medical expenses. The most tax-efficient account in the US system.
- Roth IRA up to the annual limit. Post-tax contribution, but completely tax-free growth and withdrawal in retirement. Particularly powerful early in your career when your tax bracket is low.
- 401(k) above the match, up to the annual limit. Continues the tax-deferral compounding benefit.
- Taxable brokerage account. Low-cost index funds; pay capital gains tax on growth at sale. No annual limit.
Every dollar that goes through this stack rather than sitting in checking is a dollar that joins the compounding engine. Five years from now, you will not remember which Tuesday you set up the automatic transfer. Forty years from now, the account balance will tell the story.
Common Mistakes That Sabotage Compounding
- Cashing out a 401(k) when changing jobs. Triggers income tax + 10% early withdrawal penalty under 59½ and erases the decades of compounding on those dollars. Roll over to an IRA or the new employer's plan. Never cash out unless circumstances are genuinely catastrophic.
- Pausing contributions during bad market years. This is exactly the time when your monthly contribution buys the most shares (dollar-cost averaging). Stopping in a downturn locks in the loss and forfeits the recovery purchases.
- Trying to time entries. "I'll wait for the market to dip and then start." Multiple decades of academic research show this approach reliably underperforms simply starting today. Time in the market beats timing the market — every published study, every horizon.
- Holding high-fee mutual funds. A 1.0% expense ratio that you barely notice each year compounds to a 30%+ smaller balance over 40 years. Use index funds with expense ratios under 0.1%.
- Day-trading on the side with retirement money. Short-term capital gains are taxed at ordinary income rates; transaction costs and slippage erode returns; the behavioral toll of chasing daily moves disrupts long-term planning. Keep retirement money boring.
- Stopping after a windfall. A bonus or inheritance that lands in checking and stays there is dead capital. Move it into the compounding engine within the same month it arrives.
Frequently Asked Questions
What return rate should I assume for planning? For a long-horizon (15+ year) diversified equity portfolio, 7% real (10% nominal minus 3% inflation) is the standard assumption. For a 60/40 balanced portfolio, 5% real. Skip below 4% real only if you have a specific reason; assume that the long historical record is the best estimate of long future returns.
Compound interest is great in retirement accounts, but what about a regular savings account? Same math, much lower rate. A 4% HYSA earns roughly half-percent real after inflation. Compounding still works, but the slope is very gentle. Savings accounts are for the buffer, not the wealth engine; the wealth engine is the equity portfolio.
Does compound interest work against me with debt? Yes, exactly the same math runs in reverse. A $5,000 credit card balance at 22% APR, if you pay only the minimum, more than triples to ~$16,000 over a decade. This is why paying off high-interest debt is mathematically equivalent to earning that interest rate on an investment — a 22% guaranteed return on every dollar applied to credit card paydown.
How often does compounding happen? For most financial purposes, annually is the planning convention. Brokerage accounts and savings accounts compound continuously (or daily/monthly, depending on the institution), but the difference between annual and continuous compounding at typical rates is small enough to ignore for personal finance planning. Use annual compounding in any calculator unless you have a specific reason.
What if returns are negative for several years in a row? The 7% real long-run figure is an average across decades, including downturns. A 5-year window can be substantially below — or above — the average. The compound interest math assumes you stay invested through the bad years; if you sell during downturns, you forfeit the recovery and the real return drops significantly.
Next Steps
- Open the Compound Interest Calculator. Enter your age, planned retirement age, current monthly contribution, and 7% return. See the final number.
- Increase your monthly contribution by $100. Watch the final number change. Repeat with $200, $500. The cost of "not contributing more" becomes visible.
- This week: automate one additional transfer — even $25, even $50 — into the longest-horizon account you have (Roth IRA, brokerage, 401(k) above the match). Build the muscle of small, automatic compounding deposits. Then forget about it for a decade.
Compound interest does not require intelligence. It requires patience and consistency — two of the most under-rated skills in personal finance. Start small, start now, never stop, and the math handles the rest. Forty years is a long time. Today is the earliest day you will ever have to start.
Run the numbers
Everything below came out of this site's own Savings Goal Calculator. The figures are not quoted from anywhere else: each row is one run of the same calculation the tool page performs, using August 2026 rules. Put the same inputs in and you will get the same output.
How the result moves with goal
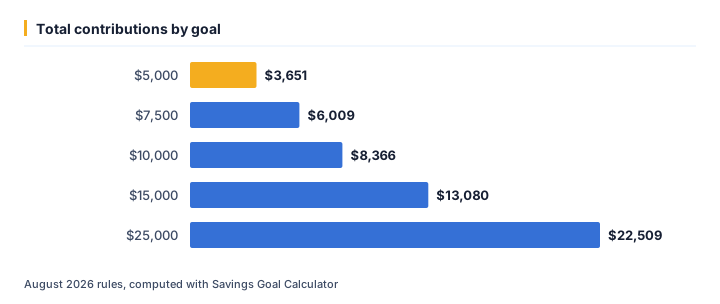
We ran 5 values of goal through the calculator and left every other input at its default. As of August 2026, the output was:
| Goal ($) | Total contributions ($) | Interest earned ($) | Needed ($) |
|---|---|---|---|
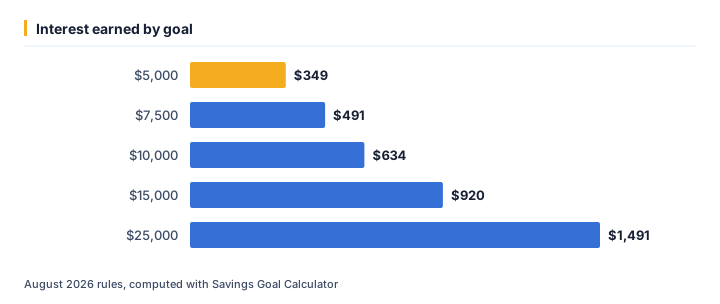
| 5,000 | 3,651.45 | 348.55 | 4,000 |
| 7,500 | 6,008.61 | 491.39 | 6,500 |
| 10,000 | 8,365.77 | 634.23 | 9,000 |
| 15,000 | 13,080.09 | 919.91 | 14,000 |
| 25,000 | 22,508.72 | 1,491.28 | 24,000 |
Running goal from $5,000 up to $25,000 moves total contributions from $3,651 to $22,509 — a spread of $18,857. That gap is the part a single headline rate never shows.
The same runs seen through interest earned
At $5,000, interest earned works out to $349; at $25,000 it is $1,491. Looking only at total contributions tends to understate how much the outcome shifts across that range.
One example, straight from the API
The middle row above (goal = $10,000) is not a rounded illustration — it is exactly what /api/v1/tools/savings-goal-calculator/calculate returns for that input, August 2026 rules:
{
    "tool": "savings-goal-calculator",
    "inputs": {
        "goal": 10000,
        "current": 1000,
        "years": 3,
        "rate": 4
    },
    "result": {
        "months": 36,
        "needed": 9000,
        "monthly_savings_required": 232.38,
        "total_contributions": 8365.77,
        "interest_earned": 634.23
    }
}
Assumptions behind these figures
| Input | Value |
|---|---|
| Goal | $10,000 |
| Current | $1,000 |
| Years | 3 years |
| Rate | 4% |
| As of | August 2026 |
| Method | identical to /tools/savings-goal-calculator |
Rates, thresholds and typical costs change over time; the numbers above are accurate as of August 2026, not a permanent guarantee. For your own situation, open the Savings Goal Calculator and enter your real numbers — the calculator runs the same code that produced every figure on this page.
Ready to crunch your numbers?
Open the Compound Interest Calculator and get an answer in seconds.
Editorial Team
We write plain-English money guides and build the free calculators behind them.