$100 in 1976 has the equivalent purchasing power of roughly $560 in 2026 — meaning the dollar has lost about 82% of its value over the past 50 years. The math has direct consequences for retirement planning, long-term savings, and how to think about cash as an asset.
Fifty years is roughly the working lifetime of an American adult — from a first job at 22 to retirement at 72. It's also the rough time horizon over which inflation transforms purchasing power from "familiar" to "barely recognizable." Looking at what $100 was worth in 1976 versus 2026 is one of the cleanest ways to see what inflation actually does over a long period, and why it matters more to long-term planning than the small annual numbers suggest.
This guide walks through the 50-year math, the decade-by-decade pattern, and the practical consequences for anyone making financial decisions today that need to hold up over a working lifetime.
The Quick Answer
According to US Consumer Price Index (CPI-U) data:
| Year | Equivalent of $100 in 2026 Dollars |
|---|---|
| 1976 | ~$561 |
| 1980 | ~$395 |
| 1985 | ~$298 |
| 1990 | ~$245 |
| 1995 | ~$208 |
| 2000 | ~$184 |
| 2005 | ~$160 |
| 2010 | ~$143 |
| 2015 | ~$132 |
| 2020 | ~$124 |
| 2024 | ~$108 |
Translation: $100 in 1976 had the same purchasing power as approximately $561 today. The dollar lost about 82% of its value over the half-century — meaning each 1976 dollar now buys what about 18 cents would have bought back then.
For any specific year-to-year purchasing power conversion, use the Inflation Calculator.
What $100 Actually Bought in 1976
To make the abstract number concrete, here is approximately what $100 could buy in the US in 1976:
- Groceries for a week for a family of four (~$30-$50 was typical)
- Round-trip airfare to many domestic destinations (~$50-$100)
- A month of utilities (electricity + gas + phone) for a small apartment (~$30-$60)
- A new TV (~$300-$500 for a midsize color TV, so $100 = down payment)
- About 280 gallons of gas at $0.36/gallon
- About 50 first-class postage stamps at $0.13 each
- A high-quality dinner for two at a midrange restaurant
- A typewriter (cheaper models)
The same $100 in 2026 buys roughly:
- About 30 gallons of gas at ~$3.30/gallon (~10% of what 1976's $100 bought)
- About 137 first-class postage stamps at $0.73 each (down from 280)
- A grocery cart for a family of four for about 1-2 days
- Roughly one-tenth of a domestic round-trip airline ticket
- A few hours of a tradesperson's time (plumber, electrician, mechanic)
The conversion isn't perfect because the basket of goods and quality has changed substantially — a 2026 smartphone is incomparable to anything 1976 produced. But the broad pattern is clear: $100 went much further in 1976 than it does today, and the gap is what 50 years of compounding inflation looks like.
Decade by Decade: The Pattern of Loss
The 82% loss didn't happen evenly. Some decades produced much faster inflation than others.
| Decade | Cumulative Inflation | Years' Average |
|---|---|---|
| 1976-1985 | ~88% | 6.5%/year |
| 1985-1995 | ~43% | 3.6%/year |
| 1995-2005 | ~28% | 2.5%/year |
| 2005-2015 | ~21% | 1.9%/year |
| 2015-2025 | ~30% | 2.7%/year |
The 1976-1985 decade was dramatically more inflationary than what followed. The drivers (covered in detail in Inflation From 1970 to 2026):
- The 1979 oil crisis pushed energy prices sharply higher
- Loose monetary policy in the late 1970s allowed inflation expectations to entrench
- The Volcker Fed eventually broke the cycle, but only after a deep recession
The 1985-2010 period saw progressively lower inflation, partly due to:
- Restored Fed credibility and explicit inflation targeting
- Globalization (cheaper imported goods)
- Productivity gains from information technology
- Increased competition in many consumer categories
The 2015-2025 period saw a return of higher inflation, driven by:
- Pandemic-related supply disruptions (2020-2022)
- Massive fiscal and monetary response to the pandemic
- Energy market disruption from the Russia-Ukraine war (2022)
- Continued labor market tightness
The 50-year cumulative result of these episodes is the 82% loss in dollar purchasing power.
What This Means for Retirement Planning
The 50-year horizon is roughly the gap from a first job to the end of retirement for many Americans. The 82% loss in $100's purchasing power is not abstract — it directly shapes how much retirement savings will actually be worth.
The retirement-target problem. A "comfortable" $50,000/year retirement income in 2026 dollars requires meaningfully more in nominal future dollars. If you retire in 30 years, that same comfort level requires approximately $121,000/year of 2056 dollars (at 3% inflation). If you retire in 40 years, it requires approximately $163,000/year. Retirement plans that target "$50,000/year" as a nominal future number consistently under-fund.
The fixed-income problem. Private pensions and annuities often pay a fixed nominal amount that doesn't adjust for inflation. A pension of $30,000/year, fixed, has the purchasing power of $30,000 in year 1, $22,400 in year 10 (at 3% inflation), $16,600 in year 20, and $12,400 in year 30. The retiree is being slowly impoverished even as the nominal check stays the same. Social Security, by contrast, has an annual cost-of-living adjustment (COLA) that partially preserves real value.
The cash-savings problem. $100,000 sitting in a non-interest-bearing account in 1976 had the purchasing power of $561,000 in 2026 dollars. The same nominal $100,000, held in cash for 50 years, has the purchasing power of only $100,000 today — an 82% loss. Money held outside of any inflation-beating vehicle bleeds purchasing power constantly.
How to Think About 50-Year Planning
Three practical principles emerge from looking at 50 years of inflation:
Plan in real (inflation-adjusted) dollars, not nominal. When estimating future expenses, savings goals, or income needs, express the target in today's dollars and account for the inflation adjustment separately. A retirement plan that says "I need $1 million" should specify whether that's in today's dollars or in retirement-day dollars — the difference is enormous over 30 years.
Use return assumptions that beat inflation by a meaningful margin. A "safe" 3% return in a 3% inflation environment is no real return at all. Long-term planning typically uses 7% nominal returns / 4% real returns as a conservative middle estimate, recognizing that this is the historical average for a diversified equity portfolio, not a guaranteed outcome.
Treat cash holdings as deliberate decisions, not defaults. A few months of expenses in cash (emergency fund) is operationally necessary. Years of cash sitting in low-yield accounts is silently destructive over long horizons. Once an emergency fund is built, additional savings should generally be in vehicles that at least match inflation (high-yield savings, short-term bonds) and ideally beat it (stocks, real estate, longer-duration bonds depending on horizon).
Specific Cost Comparisons: 1976 vs 2026
A few comparisons that help concrete the inflation reality:
| Item | 1976 Price | 2026 Price | Multiplier | vs CPI |
|---|---|---|---|---|
| Median home price | $44,200 | ~$425,000 | 9.6× | Above CPI (5.6×) |
| New car (average) | $5,500 | ~$48,000 | 8.7× | Above CPI |
| Gallon of milk | $0.79 | ~$4.00 | 5.1× | Slightly below CPI |
| Loaf of bread | $0.30 | ~$2.50 | 8.3× | Above CPI |
| Pound of ground beef | $0.97 | ~$5.50 | 5.7× | Slightly above CPI |
| First-class stamp | $0.13 | $0.73 | 5.6× | Slightly above CPI |
| Gallon of gas | $0.61 | ~$3.30 | 5.4× | Slightly below CPI |
| Movie ticket | $2.13 | ~$13 | 6.1× | Slightly above CPI |
| Median household income | $12,686 | ~$78,500 | 6.2× | Slightly above CPI |
Notice that household income has roughly kept pace with general inflation but not dramatically beaten it. The median US household is somewhat better off in real terms in 2026 than in 1976, but not transformatively — gains have come more from technological improvement (better goods at similar prices) than from wage outpacing of inflation.
Housing has substantially outpaced general inflation (about 70% above CPI), which is the largest single change in US household budgets over the period. The home that cost 3.5× annual income in 1976 costs about 5.4× annual income in 2026 — a meaningful affordability deterioration.
What About the Next 50 Years?
Honest answer: nobody knows. But some baseline expectations:
Long-term US inflation has averaged ~3%. This is the rough planning anchor most economists use. The 1976-2026 period averaged slightly above this (closer to 3.5%) due to the 1970s episode.
Central banks now explicitly target 2% inflation. This is structurally different from the 1970s monetary regime. If central banks remain credible, average inflation should be more contained than the worst episodes of the past 50 years.
New inflationary forces could emerge. Aging demographics (fewer workers per retiree), climate-related supply shocks, ongoing geopolitical conflict, and partial de-globalization could push inflation higher than the historical 3% average.
Real wage growth depends on productivity. If productivity growth is strong, wages can rise faster than inflation, keeping real income gains positive. If productivity stagnates, real wages may stagnate or decline.
For planning, a reasonable assumption is 3% average annual inflation over the next 50 years, with the understanding that any given decade could be higher or lower. Use the Inflation Calculator to model specific scenarios with adjustable assumptions.
Frequently Asked Questions
How does the CPI account for product quality changes? The Bureau of Labor Statistics uses "hedonic adjustments" to account for quality improvements — when a $1,000 TV in 2026 is dramatically better than a $1,000 TV in 1996, the CPI adjusts the price comparison to reflect the quality change. This is an imperfect process and has critics on both sides (some say it under-states inflation, others say it over-corrects). For long-term planning, accept the CPI as the best available approximation.
Why has housing outpaced general inflation? Several factors: zoning restrictions that limit supply in high-demand areas, land scarcity in desirable metros, increased home size and feature expectations, and demographic demand from a growing population concentrated in fewer metro areas. Housing is a unique category where local supply constraints can push prices well above general inflation.
Is wage inflation matching consumer inflation? Generally yes over very long periods, with significant variation by sector and skill level. Median US household income has roughly kept pace with the CPI over the past 50 years, though the gains have not been evenly distributed across the income distribution.
What about the future — could deflation happen? Possible but uncommon in modern monetary regimes. The Great Depression (1929-1933) saw approximately 25% deflation. Japan has experienced low-grade deflation periodically since 1990. The Fed actively designs monetary policy to avoid deflation, which is one reason the 2% inflation target sits modestly above zero.
Does inflation hit everyone the same? No. Lower-income households spend more of their budget on essentials (food, energy, housing, healthcare) — categories that often inflate faster than the overall CPI. Higher-income households have more exposure to technology and services that have deflated. Retirees on fixed incomes generally lose ground; workers with wage growth that keeps pace generally maintain purchasing power.
What's the best inflation hedge for individual savers? Over long horizons, broad equity ownership (stocks) has been the most reliable inflation beater. Real estate has historically outpaced inflation. TIPS (Treasury Inflation-Protected Securities) provide direct inflation indexation. High-yield savings keeps pace with inflation in most years. Cash held outside of any interest-bearing vehicle is the worst long-term option.
Next Steps
For any specific year-to-year purchasing power calculation, use the Inflation Calculator — it handles US CPI data from 1913 to present.
For the conceptual framework of how inflation interacts with your savings, see Understanding Inflation and Your Money and Inflation From 1970 to 2026: How the Dollar Lost Its Power.
The 50-year horizon — the gap from a first job to the end of retirement for many Americans — is exactly the timescale where understanding inflation pays off in real dollars. Planning that ignores 50-year inflation under-funds retirement consistently; planning that accounts for it produces dramatically better outcomes for the same monthly contributions.
Run the numbers
Everything below came out of this site's own Compound Interest Calculator. The figures are not quoted from anywhere else: each row is one run of the same calculation the tool page performs, using August 2026 rules. Put the same inputs in and you will get the same output.
How the result moves with principal
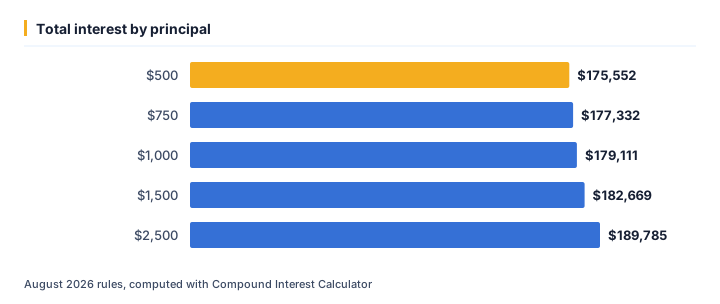
We ran 5 values of principal through the calculator and left every other input at its default. As of August 2026, the output was:
| Principal ($) | Total interest ($) | Total contributed ($) | Future value ($) |
|---|---|---|---|
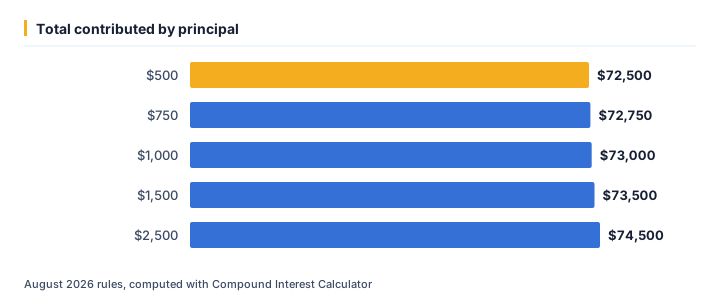
| 500 | 175,552.45 | 72,500 | 248,052.45 |
| 750 | 177,331.57 | 72,750 | 250,081.57 |
| 1,000 | 179,110.7 | 73,000 | 252,110.7 |
| 1,500 | 182,668.95 | 73,500 | 256,168.95 |
| 2,500 | 189,785.44 | 74,500 | 264,285.44 |
Running principal from $500 up to $2,500 moves total interest from $175,552 to $189,785 — a spread of $14,233. That gap is the part a single headline rate never shows.
The same runs seen through total contributed
At $500, total contributed works out to $72,500; at $2,500 it is $74,500. Looking only at total interest tends to understate how much the outcome shifts across that range.
One example, straight from the API
The middle row above (principal = $1,000) is not a rounded illustration — it is exactly what /api/v1/tools/compound-interest-calculator/calculate returns for that input, August 2026 rules:
{
    "tool": "compound-interest-calculator",
    "inputs": {
        "principal": 1000,
        "monthly": 200,
        "rate": 7,
        "years": 30,
        "freq": 12
    },
    "result": {
        "future_value": 252110.7,
        "total_contributed": 73000,
        "total_interest": 179110.7,
        "growth_multiple": 3.45
    }
}
Assumptions behind these figures
| Input | Value |
|---|---|
| Principal | $1,000 |
| Monthly | $200 |
| Rate | 7% |
| Years | 30 years |
| Freq | $12 |
| As of | August 2026 |
| Method | identical to /tools/compound-interest-calculator |
Rates, thresholds and typical costs change over time; the numbers above are accurate as of August 2026, not a permanent guarantee. For your own situation, open the Compound Interest Calculator and enter your real numbers — the calculator runs the same code that produced every figure on this page.
Ready to crunch your numbers?
Open the Compound Interest Calculator and get an answer in seconds.
Editorial Team
We write plain-English money guides and build the free calculators behind them.