Where you live changes the math of every personal finance decision. A $90,000 salary funds a different life in Pittsburgh than in San Francisco — here is how to read the differences honestly.
A $90,000 salary in Pittsburgh is functionally upper-middle-class. The same $90,000 in San Francisco buys a tight one-bedroom and a high stress level. The same $90,000 in Detroit funds outright home ownership. Where you live changes the math of every personal finance decision more than almost any other variable — and the differences between U.S. cities are wider in 2026 than at any point in recent decades.
This guide walks through how cost of living actually decomposes (housing, taxes, transportation, food, healthcare, services), how it varies across U.S. cities, what specific salary equivalents look like in major metros, how to honestly evaluate a potential move, and the second-order effects (commute, social network, lifestyle) that the headline numbers usually miss.
What "Cost of Living" Actually Means
Cost of living indexes attempt to capture the total cost of maintaining a comparable lifestyle in different locations. Multiple organizations produce these indexes: the Council for Community and Economic Research (C2ER), Numbeo, MIT's Living Wage Calculator, and others. They generally agree directionally; the precise numbers vary based on the basket of goods and weighting choices.
A typical cost of living comparison uses a national average of 100 as the baseline. A city with an index of 130 costs 30% more than national average to maintain a comparable lifestyle; a city with an index of 85 costs 15% less.
The headline indices, while useful, hide important structure:
- Housing dominates. In most index methodologies, housing is 25–35% of the basket. The variation across cities for housing alone is dramatic (San Francisco housing costs are 3–5× the national average), so cities high in housing tend to be high overall regardless of other categories.
- Taxes are often understated. State and local income tax, sales tax, and property tax vary substantially. A 10% effective state-and-local tax burden in California vs. 0% in Texas/Florida creates a $9,000–$15,000 annual difference on a $100,000 income — comparable to a major housing differential.
- Healthcare costs vary less than expected. Insurance premiums vary modestly by state, but medical procedure costs and prescription drug costs are surprisingly similar across regions.
- Goods (food, clothing, household items) vary least. A gallon of milk costs roughly the same in most U.S. cities. Categories with national-chain pricing (groceries, electronics, clothing) show minimal geographic variation.
The takeaway: when comparing cities, the headline cost-of-living index is a starting point. The decomposition — what specifically costs more, and what costs the same — matters more than the single number.
The Decomposition: Where the Real Differences Live
Housing
The single largest variable. Median home prices and rents across major U.S. metros in 2026:
| Metro | Median home price | Median 1BR rent |
|---|---|---|
| San Francisco | $1.2M+ | $3,000–$3,800 |
| New York City | $850K–$1.1M | $3,400–$4,000 (Manhattan), lower in outer boroughs |
| Boston | $750K | $2,800 |
| San Jose | $1.4M | $2,800–$3,400 |
| Seattle | $850K | $2,200 |
| Los Angeles | $950K | $2,400 |
| Washington DC | $700K | $2,500 |
| Denver | $620K | $1,900 |
| Austin | $560K | $1,750 |
| Chicago | $370K | $2,100 |
| Atlanta | $400K | $1,600 |
| Phoenix | $475K | $1,650 |
| Charlotte | $420K | $1,500 |
| Pittsburgh | $230K | $1,250 |
| Cleveland | $180K | $1,150 |
| Detroit | $150K | $1,100 |
The ratios are striking. A first-time home buyer in Cleveland or Detroit puts roughly $35,000 down on a $180,000 home and faces a $1,000 mortgage payment. A first-time home buyer in San Francisco faces $240,000+ down on a $1.2M home and a $5,500 monthly mortgage payment — even after qualifying, which is a hurdle in itself.
These differences are not optional luxury upgrades. They are the structural floor of housing in each metro.
Taxes
State income tax burden, before deductions:
| State | Top marginal rate | Notes |
|---|---|---|
| Florida, Texas, Washington, Tennessee, Nevada, Alaska, Wyoming, South Dakota, New Hampshire | 0% | No state income tax |
| Pennsylvania | 3.07% | Flat |
| Indiana, North Dakota | ~3% | Flat or near-flat |
| Colorado, Illinois | 4.4–4.95% | Flat |
| Georgia, North Carolina | ~5% | Flat or near-flat |
| Massachusetts | 5–9% (over $1M) | Flat with surtax |
| New Jersey | 1.4–10.75% | Progressive |
| Oregon | 4.75–9.9% | Progressive |
| New York | 4–10.9% | Progressive; plus NYC local |
| California | 1–13.3% | Progressive; high-income brackets steep |
| Hawaii | 1.4–11% | Progressive |
State income tax on a $120,000 salary varies from $0 (TX, FL, etc.) to roughly $7,500–$10,500 (CA, NY, OR, HI). Property tax rates also vary — Texas and New Jersey have notably high property taxes (1.6–2.4% of assessed value) while California's Proposition 13 caps the increase at 2% per year for current owners (but new buyers face market-rate assessments).
Sales tax rates vary from 0% (some states) to 10%+ in combined state+local (some cities in TN, AR, LA, WA). For a household spending $50,000 a year on taxable goods, the sales tax difference between Oregon (no sales tax) and Tennessee (~9.5%) is roughly $4,500 annually.
The full state-and-local tax picture is the second-largest difference between U.S. metros, after housing.
Transportation
Transportation costs depend on (a) whether owning a car is required, (b) commute distance, and (c) parking and tolls.
- No car required (NYC, San Francisco proper, some Boston, central Chicago, central DC): public transit fare ~$120–$150/month. Total transportation: $1,500–$2,500/year.
- One car required (most US metros, even those with transit): $700–$1,000/month all-in (loan payment, insurance, gas, maintenance, parking). Total: $8,400–$12,000/year.
- Two cars required (most suburbs, virtually all of the South and West outside dense cores): $1,400–$2,000/month combined. Total: $16,800–$24,000/year.
The no-car-required metros save households $8,000–$15,000 annually on transportation — partially offsetting their higher housing costs.
Food and Groceries
Less variation than expected. Grocery costs in major US cities range from 90% to 115% of national average. The bigger food-cost differential is in restaurant prices: a sit-down dinner in San Francisco or NYC costs 30–40% more than in Pittsburgh or Atlanta for comparable cuisine. Households who eat out frequently see substantial cost-of-living differential they may attribute to "everything being expensive" when the real driver is restaurant cost variation.
Childcare
For households with young children, childcare is often the largest line item after housing. Full-time daycare ranges from:
- $800–$1,500/month in many lower-cost areas
- $1,500–$2,200/month in middle-cost metros
- $2,500–$4,000/month in NYC, SF, Boston, DC
Annualized: $30,000–$48,000 in major-metro markets. This is a hidden cost-of-living differential that childless households or households with older children don't see in the headline index — but it dominates household budgets for those affected.
Healthcare
Surprisingly stable nationally. Premium variation by state exists but is smaller than housing or tax variation. Procedure cost variation also exists (some states have notably lower medical costs) but is rarely a major driver of geographic decisions.
Salary Equivalents Across Major Metros
A salary in one city does not "convert" cleanly to another because the budgets bend differently — but useful rough equivalents help frame comparisons. For a single working adult, no kids, modest urban lifestyle:
| City | Comparable salary for $90,000 in Pittsburgh |
|---|---|
| Pittsburgh | $90,000 (baseline) |
| Cleveland | $85,000 |
| Atlanta | $98,000 |
| Charlotte | $98,000 |
| Phoenix | $102,000 |
| Denver | $115,000 |
| Austin | $112,000 |
| Chicago | $108,000 |
| Seattle | $135,000 (no state income tax helps) |
| Boston | $145,000 |
| Washington DC | $138,000 |
| Los Angeles | $145,000 |
| New York City (Manhattan) | $160,000+ |
| San Francisco | $175,000+ |
These ratios are approximations and vary by lifestyle. A household maintaining a more austere lifestyle (small apartment, no car, minimal dining out) sees compressed differentials; a household maintaining the same lifestyle in each city sees expanded differentials.
The math for household decisions: if a job in San Francisco pays 80% more than a comparable job in Pittsburgh, the household is roughly equivalent in lifestyle terms, not better off. The remote-work era has scrambled this calculus for many knowledge workers — earning a coastal salary while living in Pittsburgh is the strongest single financial arbitrage available to many professionals.
Evaluating a Potential Move
When considering a city move, work through this checklist before signing any lease or accepting any offer.
1. Translate the salary
Use a cost-of-living calculator (Bankrate, Numbeo, NerdWallet) to translate. Pay particular attention to housing-specific differentials, not just the headline index. Sanity check by looking at actual rentals or homes in the target city for the type of housing you would actually live in.
2. Compute state-and-local tax burden
A new state means new state income tax, new property tax, new sales tax. Compute the all-in difference on your specific income level. The Tax Foundation publishes useful per-state effective tax burden estimates; cross-check against your specific situation.
3. Add or subtract car costs
Going from a car-required to a car-optional city: subtract $8,000–$12,000/year per car eliminated. Going the other direction: add the same.
4. Estimate childcare and school costs
For households with kids, this can dwarf other differences. Daycare costs in target city + cost of private school if public schools in the target area don't fit + after-school activities.
5. Map the second-order effects
The variables hard to quantify but consequential:
- Commute time. A 90-minute commute in NYC vs. a 20-minute commute in Pittsburgh is a 70-minute-per-day quality of life difference for the rest of your career.
- Social network. Most close friendships in adulthood form through proximity. A move erases the proximity-based network; rebuilding takes 18 months to several years depending on age and life stage.
- Weather and lifestyle. Texas summers, Minnesota winters, San Diego year-round, Seattle rain. Personal factors that nonetheless meaningfully affect long-term satisfaction.
- Career opportunity density. Some industries are concentrated geographically (tech in SF/NYC/Austin/Seattle, finance in NYC, energy in Houston, healthcare and biotech in Boston). Living outside the cluster may mean fewer mid-career opportunities and the need to relocate again later.
6. Run the FI math
Use the Compound Interest Calculator to compute the FI implications of each scenario. A lower-cost-of-living city allows higher savings rates at the same lifestyle, which can compress an FI timeline by years.
7. Stress-test for job loss
If your spouse loses their job, or if you do, in 18 months — can you survive financially? Cities with deep job markets (any major metro) offer more resilience; smaller cities can leave a household stuck in a single-employer dependency.
Common Cost-of-Living Mistakes
- Comparing only the housing line. Housing matters most, but ignoring tax, transportation, and childcare differentials can hide 20–30% of real cost differences.
- Assuming higher salary = better lifestyle. A 60% salary increase in a city with 80% higher costs is a net lifestyle decrease.
- Underestimating transportation costs in car-required cities. Two-car households cost $20,000+ annually in transportation; this often surprises households moving from no-car metros.
- Not budgeting for move costs. A long-distance move costs $4,000–$12,000+ depending on distance and household size. Plus deposits, possible double rent, temporary housing if needed. Budget the move itself.
- Ignoring state income tax differentials at retirement. A retiree moving from California (taxable Social Security and pension) to Florida (no state income tax) saves substantial annual tax on a $80,000 retirement income — often $4,000–$7,000 per year, compounding over a 25-year retirement.
- Comparing to a few specific data points rather than the realistic average. "I can find a 1BR for $1,800 in San Francisco!" — possible, but typically in marginal neighborhoods or distant suburbs. Compare to the median you'd realistically want, not the cheapest theoretical option.
Frequently Asked Questions
Is it always better to move to a lower cost-of-living area? No. Career opportunity, social connections, and personal fit all matter. The strongest argument for staying in a high-cost area is career trajectory (e.g., tech careers concentrated in specific clusters); the strongest argument for moving is the explicit FI/lifestyle tradeoff being acceptable.
How much does remote work change this analysis? Substantially. Earning a coastal salary while living in a moderate-cost city is the single most powerful financial arbitrage available to remote workers. Many companies have begun adjusting salaries based on location, but the differentials are usually smaller than full cost-of-living differences would imply — meaning the worker still captures meaningful surplus.
Should I move just to save on taxes? For high earners ($300,000+) approaching retirement, the long-term state income tax savings can be substantial — easily $50,000+ annually for very high earners in retirement. For middle earners, the savings exist but are smaller and may not justify the upheaval of a move.
What about the impact on Social Security and Medicare? Both are federal programs, so geographic location doesn't change benefits. Medicare premiums and out-of-pocket vary slightly by state. Social Security benefits go further in lower-cost areas, which is a meaningful factor in retiree relocation decisions.
How do I evaluate cost of living for a partial-year move (snowbirding)? Treat each location as a partial-year resident; many states have specific rules for residency, which affects tax obligations. A common pattern: legal residency in a low-tax state, with seasonal time in a higher-cost area. Tax planning around residency rules can preserve substantial value but requires careful execution.
What about international moves? Different category entirely. Healthcare systems, tax structures, currency risks, and visa rules dominate. International cost-of-living comparisons require deep dives that go well beyond US-to-US methodology.
Next Steps
- Run a cost-of-living comparison between your current city and one realistic alternative city using Bankrate or NerdWallet. Note the housing-specific differential separately from the headline number.
- Compute the all-in state-and-local tax difference for your income level.
- Translate the comparison into your FI timeline using the Compound Interest Calculator. The differential in years-to-FI is the most consequential outcome of any city decision.
Cost of living is one of the largest financial variables in any working life. The U.S. spreads costs across cities more widely than most other developed countries do. Knowing the structure honestly — what specifically differs, what does not, and what is masked by headline numbers — turns a vague "is it cheaper there" question into the concrete budget math that actually decides whether a move makes sense.
Run the numbers
Everything below came out of this site's own Budget Calculator (50/30/20). The figures are not quoted from anywhere else: each row is one run of the same calculation the tool page performs, using August 2026 rules. Put the same inputs in and you will get the same output.
How the result moves with income
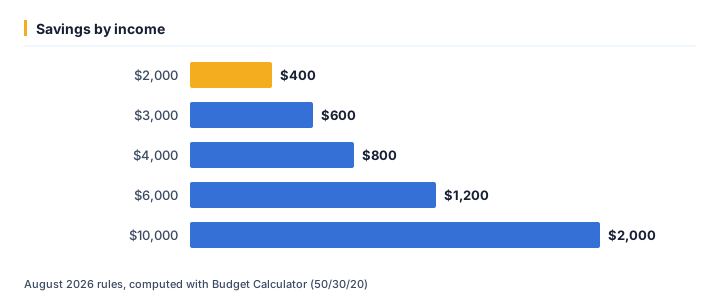
We ran 5 values of income through the calculator and left every other input at its default. As of August 2026, the output was:
| Income ($) | Savings ($) | Needs ($) | Wants ($) |
|---|---|---|---|
| 2,000 | 400 | 1,000 | 600 |
| 3,000 | 600 | 1,500 | 900 |
| 4,000 | 800 | 2,000 | 1,200 |
| 6,000 | 1,200 | 3,000 | 1,800 |
| 10,000 | 2,000 | 5,000 | 3,000 |
Running income from $2,000 up to $10,000 moves savings from $400 to $2,000 — a spread of $1,600. That gap is the part a single headline rate never shows.
The same runs seen through needs
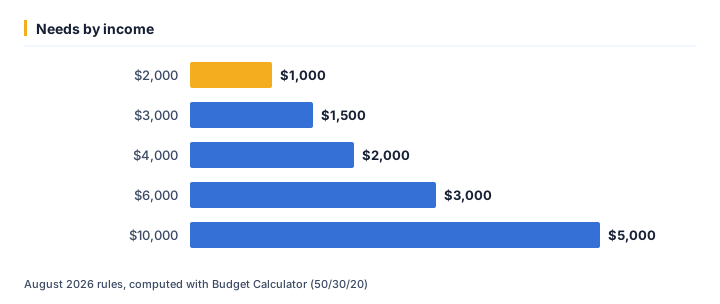
At $2,000, needs works out to $1,000; at $10,000 it is $5,000. Looking only at savings tends to understate how much the outcome shifts across that range.
One example, straight from the API
The middle row above (income = $4,000) is not a rounded illustration — it is exactly what /api/v1/tools/budget-calculator/calculate returns for that input, August 2026 rules:
{
    "tool": "budget-calculator",
    "inputs": {
        "income": 4000
    },
    "result": {
        "needs": 2000,
        "wants": 1200,
        "savings": 800
    }
}
Assumptions behind these figures
| Input | Value |
|---|---|
| Income | $4,000 |
| As of | August 2026 |
| Method | identical to /tools/budget-calculator |
Rates, thresholds and typical costs change over time; the numbers above are accurate as of August 2026, not a permanent guarantee. For your own situation, open the Budget Calculator (50/30/20) and enter your real numbers — the calculator runs the same code that produced every figure on this page.
Ready to crunch your numbers?
Open the Budget Calculator (50/30/20) and get an answer in seconds.
Editorial Team
We write plain-English money guides and build the free calculators behind them.