Financial independence is not a job title or a windfall — it is a specific number (roughly 25× annual expenses) reached by a specific sequence of decisions. Here is exactly how the math and the path work.
Financial independence — usually shortened to FI — is the moment your invested net worth is large enough that work becomes optional. You may keep working because you love it, because the social structure suits you, or because a specific project needs finishing. You may stop, switch fields, take a sabbatical, or simply work less. The point is that the choice is yours.
Reaching FI is not a windfall question. It is a math problem with a specific answer, reachable by a specific sequence of decisions, on a timeline that depends almost entirely on how much of your income you save. This guide walks through the framework — the 25× rule that defines your target number, the savings-rate-to-years math that determines your timeline, the order of operations that matters, the lifestyle trade-offs that separate plans that work from plans that don't, and the post-FI considerations most aspiring early retirees don't think about until they're already there.
What Financial Independence Actually Means
FI is reached when your invested net worth is large enough that a sustainable withdrawal rate covers your annual expenses, indefinitely. The "sustainable withdrawal rate" is the percentage of the portfolio you can spend each year without running out of money across a long retirement horizon.
The most widely cited withdrawal rate is 4%, derived from the Trinity Study — a 1998 academic analysis of US historical market data showing that a 4% initial withdrawal rate (adjusted annually for inflation) survived 30+ year retirement horizons in nearly all historical starting periods. Some modern analyses argue 3.3–3.5% is more durable for very long (40–60 year) early-retirement horizons; some argue 4% is sufficient for conventional retirement.
The math, derived from 4%: FI number = 25 × annual expenses.
A household with $50,000 annual expenses reaches FI at $1.25 million invested. A household with $80,000 annual expenses needs $2 million. A household with $30,000 annual expenses (yes, that's possible for many in lower-cost areas) needs just $750,000. The target scales linearly with expenses, not with income.
This is the most important insight in the entire FI framework: your FI number is determined by what you spend, not what you earn. Two households earning $150,000 a year can be on completely different FI trajectories depending on whether they spend $60,000 or $130,000 of it.
Compute Your FI Number Today
The exercise is short:
- Compute your honest annual expenses. Pull 12 months of statements; sum every category. Include taxes, insurance, the lumpy irregular costs (vacations, gifts, holidays, vehicle repairs). For pre-retirees, subtract any retirement contributions and pre-tax health insurance premiums that won't continue post-FI.
- Multiply by 25. That is your portfolio target.
- Subtract your current invested net worth (retirement + brokerage + other investable assets, excluding home equity unless you plan to sell). That is the gap.
Example: a household with $55,000 in real annual expenses targets $1.375 million. They currently have $310,000 invested. The gap is $1.065 million.
This number, in isolation, can feel intimidating. The savings-rate math below converts it into a timeline that's surprisingly fast for households committed to the path.
The Savings-Rate-to-Years Math
The single most consequential insight in FI: the years required to reach FI depend almost entirely on your savings rate, not on your absolute income or starting point.
The relationship, approximated for a portfolio earning 5% real return after fees and taxes:
| Savings rate | Years to FI |
|---|---|
| 10% | 51 years |
| 15% | 43 years |
| 20% | 37 years |
| 25% | 32 years |
| 30% | 28 years |
| 40% | 22 years |
| 50% | 17 years |
| 60% | 12.5 years |
| 70% | 8.5 years |
| 80% | 5.5 years |
A household saving 50% of take-home pay reaches FI in about 17 years, regardless of whether their income is $60,000 or $300,000. The percentage matters more than the dollar amount because the same percentage simultaneously increases the contribution and decreases the FI number (lower spending → lower target).
This is why the path looks different for FI-pursuing households than for typical American households. Median US savings rates run 5–10%. A 30-year FI plan requires roughly 25–30% savings; a 15-year plan requires 50%; a sub-10-year sprint requires 70%+. None of these are "extreme" in any technical sense — they require directing income toward the portfolio rather than toward lifestyle.
The Compound Interest Calculator can project specific scenarios: enter current portfolio, annual contribution, expected return, and the calculator gives the exact year you cross the FI threshold.
The Five Levers
Five concrete decisions move your FI timeline. Pull each of them and the years compress.
Lever 1: Income
Above a certain baseline, every additional dollar of income that flows to the portfolio shortens FI. The tactics: aggressive salary negotiation (see Salary Negotiation: Maximizing Your Worth), switching companies for 15–25% jumps, developing specialty skills that command premium wages, modest side income directed entirely to investments.
Income alone is not the lever — high earners who spend everything reach FI no faster than middle earners who save 30%. But income combined with savings discipline is the fastest single accelerant.
Lever 2: Expenses
The often-overlooked lever, doubly powerful because every dollar of expense reduction simultaneously increases the savings rate and reduces the FI target. Cutting $5,000/year in expenses:
- Saves an extra $5,000/year toward FI.
- Lowers the FI target by $125,000 (25 × $5,000).
That single change moves the FI date forward by 2–4 years for typical households. The biggest leverage categories: housing (the single largest household expense), transportation, and food (combined with dining out). Optimizing all three is often the difference between a 30-year plan and a 15-year plan.
Lever 3: Tax Efficiency
Every dollar that flows through tax-advantaged accounts compounds without annual tax drag, dramatically accelerating FI. The hierarchy:
- 401(k) up to the match (free money).
- HSA if eligible (triple tax advantage).
- Roth IRA up to the annual limit.
- 401(k) above the match, up to the annual limit.
- After-tax savings into a taxable brokerage.
Households who saturate the tax-advantaged accounts before touching taxable brokerage often shave 3–5 years off their timeline.
Lever 4: Investment Strategy
Boring is correct. Low-cost, broadly diversified index funds outperform actively managed strategies for the vast majority of investors over multi-decade horizons. Stock picking, market timing, and exotic strategies all have similar effect: they make some investors feel sophisticated while delivering returns at or below the index.
Three-fund portfolios (total US stock, total international stock, total US bond) are the standard FI portfolio. Expense ratios should be under 0.1%. Rebalance annually. Do nothing during market downturns except keep contributing.
Lever 5: Geographic and Lifestyle Arbitrage
Where you live, especially in retirement, can change the FI number by 30–50%. A household needing $80,000/year in San Francisco might need $50,000/year in Pittsburgh — meaning they reach FI at $1.25M instead of $2M, a difference of 5–8 years of working.
Even within a working career, choosing to live in a moderate cost-of-living city while earning a coastal salary (when remote work allows it) is one of the most powerful FI accelerants available to working professionals.
The Order of Operations
The path itself, in sequence:
- $1,000 starter emergency fund. Before anything else.
- Capture employer 401(k) match. Free money.
- Eliminate high-interest debt (>7% APR).
- Build 3–6 month emergency fund.
- Max tax-advantaged accounts in the order above.
- Add taxable brokerage contributions with whatever surplus remains.
- Continue, automated, for the duration until the portfolio crosses 25× annual expenses.
Steps 1–4 are the foundation; almost every personal finance educator agrees on this part. Step 5–7 is where FI households diverge from typical-savings households: the absolute and percentage contribution to investments is dramatically higher, sustained for many years.
The path is not glamorous. It is monthly auto-contributions, annual rebalancing, occasional savings-rate increases when income rises, and patience across years of unremarkable progress. The 5-year mark feels slow; the 10-year mark feels promising; the 15-year mark is when the curve bends and the math starts to feel inevitable.
The Variations: Lean FI, Fat FI, Coast FI, Barista FI
The FI community has developed several variants worth knowing:
- Lean FI — FI at the low end of expenses ($30,000–$45,000/year). Requires lower portfolio target (often $750k–$1.1M); usually involves geographic moves, modest lifestyle, and careful budgeting. Reachable in 10–15 years for high savers.
- Regular FI — the standard 25× rule, typically $50,000–$80,000/year expenses, $1.25M–$2M portfolio.
- Fat FI — FI at higher expense levels ($100,000+/year), $2.5M+ portfolio. Allows substantial discretionary spending in retirement; takes longer to reach.
- Coast FI — your invested portfolio is large enough today that, with no further contributions, it will compound to a full FI number by traditional retirement age. From Coast FI, you can "coast" — reduce work hours, switch to lower-paying meaningful work, or take career breaks — without contributing further to retirement.
- Barista FI — partial FI, where investments cover most expenses but a part-time job covers the remainder (especially health insurance — a major US-specific consideration).
Most FI seekers shift between these categories over their journey. A household might reach Coast FI in their 30s, take a few years of slower work, then push for full FI in their 40s.
The Common Mistakes
- Underestimating annual expenses. Most households underestimate by 10–25%, missing irregular costs like annual insurance premiums, vehicle replacement reserves, healthcare deductibles, and tax obligations.
- Including home equity in the FI number. Home equity is part of net worth but not part of the invested portfolio that funds withdrawals. Either subtract home equity from net worth before applying the 25× rule, or include rent/maintenance assumptions when computing the FI expense base.
- Forgetting healthcare costs in the US. Pre-Medicare-age early retirees face substantial healthcare premium costs that don't exist for the working-age FI population. Budget realistically for ACA marketplace coverage or COBRA. This often adds $10,000–$20,000/year to early-retiree expenses.
- Forgetting taxes. Withdrawals from traditional 401(k)/IRA are taxable; capital gains from brokerage accounts are taxable. Build a tax estimate into your annual expense calculation, or use after-tax withdrawal modeling.
- Treating 4% as a guarantee rather than a guideline. The 4% rule worked in nearly all historical 30-year periods, but not all. Stress-test against 3.5% and 3% scenarios. The earlier your FI, the more conservative your withdrawal rate should be (since the horizon is longer).
- Underestimating sequence-of-returns risk. A market downturn in the first 5 years of retirement is far more damaging than the same downturn in years 20–25. The right mitigations: hold 2–3 years of expenses in cash + short bonds entering retirement; have flexible spending you can dial back during bear markets; consider modest part-time work during downturn years.
- Failing to plan what comes after. "Reaching FI" is a financial outcome; "what do I do for the next 40 years" is a life question many FI seekers don't seriously address until they're already there. The healthier FI plans bake in identity, purpose, and structure for the post-FI years.
Frequently Asked Questions
Is FI realistic for people with average incomes? Yes, especially for households who can sustain savings rates of 30%+ and live in moderate cost-of-living areas. Median-income households who follow the order of operations rigorously typically reach FI in 25–35 years — substantially faster than the standard 40-year working career. Top-quartile income households at 50%+ savings rates can reach FI in 12–17 years.
Does 4% still work as a withdrawal rate? For 30-year retirements starting at standard ages (60+), most analyses still support 4% as a reasonable initial rate with annual inflation adjustments. For longer horizons (40+ years for early retirees), 3.3–3.75% is a more conservative starting point. Variable withdrawal strategies (cutting back during bad market years) further increase safety.
Should I include Social Security in my FI math? Generally yes, but conservatively. Social Security replaces 30–50% of pre-retirement income for most workers (less for high earners). For traditional-age retirees, the math is supportive. For early retirees aiming for FI by 45, Social Security at 62–67 is a buffer against running out of money rather than a primary income stream — count it as a backstop, not as part of the primary 25× number.
What about healthcare before Medicare? The biggest US-specific FI challenge. Pre-65 early retirees rely on ACA marketplace coverage, COBRA, a spouse's employer plan, or part-time work that provides insurance. Realistic 2026 ACA marketplace premiums for a family of four in a moderate state: $1,200–$2,200/month. Build this into the FI expense base; underestimating healthcare is the most common FI planning error.
Should I pay off my mortgage before reaching FI? Math typically favors keeping a low-rate fixed mortgage and investing the difference. A 4% mortgage held against a 7% expected real return on equity investments is mathematically a positive trade. The exception: many FI households psychologically prefer a paid-off mortgage at FI for the lower monthly expense floor, which lowers the FI number itself. Both approaches are defensible.
What if the market crashes right after I reach FI? This is sequence-of-returns risk, and it's real. Mitigations: hold 2–3 years of expenses in cash or short bonds at the FI threshold, plan to dial back discretionary spending in bad market years, consider modest part-time income in the first 3–5 years post-FI as a buffer, and avoid lifestyle inflation in the early FI years until the portfolio shows it can support the spending.
Is it worth the sacrifice? A personal question with no universal answer. Households who pursue FI by depriving themselves of all current joy often burn out before reaching the goal. The sustainable FI path balances aggressive savings with current quality of life — saving 40% while living comfortably is a 22-year plan that most households can sustain; saving 70% while feeling miserable is rarely sustained past year 3.
Next Steps
- Compute your current annual expenses honestly (12 months of statements, every category). Multiply by 25 to get your FI number. Subtract current invested net worth to see the gap.
- Compute your current savings rate (after-tax savings + retirement contributions ÷ gross or net income). Use the savings-rate-to-years table to estimate your current timeline.
- Pick the single lever above that has the most room in your situation — usually expenses or income — and identify one specific change to make this quarter. Move savings rate by 3–5% and re-check the timeline.
Financial independence is not a fantasy reserved for high earners. It is the mechanical result of a savings rate sustained over time. The households who reach it are not the smartest or the highest-paid — they are the ones who made the boring decisions consistently for 15-25 years and watched the math do the rest.
Run the numbers
Everything below came out of this site's own Savings Goal Calculator. The figures are not quoted from anywhere else: each row is one run of the same calculation the tool page performs, using August 2026 rules. Put the same inputs in and you will get the same output.
How the result moves with goal
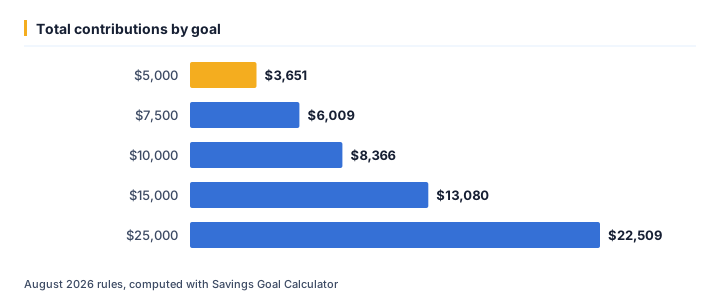
We ran 5 values of goal through the calculator and left every other input at its default. As of August 2026, the output was:
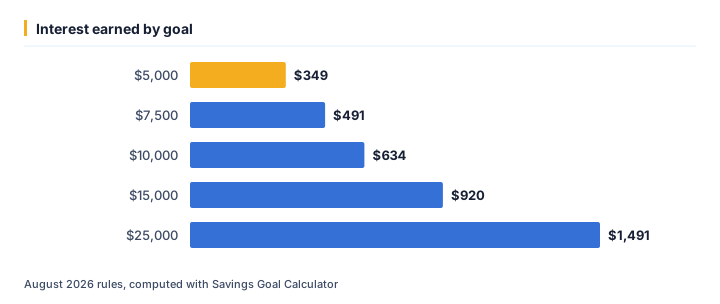
| Goal ($) | Total contributions ($) | Interest earned ($) | Needed ($) |
|---|---|---|---|
| 5,000 | 3,651.45 | 348.55 | 4,000 |
| 7,500 | 6,008.61 | 491.39 | 6,500 |
| 10,000 | 8,365.77 | 634.23 | 9,000 |
| 15,000 | 13,080.09 | 919.91 | 14,000 |
| 25,000 | 22,508.72 | 1,491.28 | 24,000 |
Running goal from $5,000 up to $25,000 moves total contributions from $3,651 to $22,509 — a spread of $18,857. That gap is the part a single headline rate never shows.
The same runs seen through interest earned
At $5,000, interest earned works out to $349; at $25,000 it is $1,491. Looking only at total contributions tends to understate how much the outcome shifts across that range.
One example, straight from the API
The middle row above (goal = $10,000) is not a rounded illustration — it is exactly what /api/v1/tools/savings-goal-calculator/calculate returns for that input, August 2026 rules:
{
    "tool": "savings-goal-calculator",
    "inputs": {
        "goal": 10000,
        "current": 1000,
        "years": 3,
        "rate": 4
    },
    "result": {
        "months": 36,
        "needed": 9000,
        "monthly_savings_required": 232.38,
        "total_contributions": 8365.77,
        "interest_earned": 634.23
    }
}
Assumptions behind these figures
| Input | Value |
|---|---|
| Goal | $10,000 |
| Current | $1,000 |
| Years | 3 years |
| Rate | 4% |
| As of | August 2026 |
| Method | identical to /tools/savings-goal-calculator |
Rates, thresholds and typical costs change over time; the numbers above are accurate as of August 2026, not a permanent guarantee. For your own situation, open the Savings Goal Calculator and enter your real numbers — the calculator runs the same code that produced every figure on this page.
Ready to crunch your numbers?
Open the Compound Interest Calculator and get an answer in seconds.
Editorial Team
We write plain-English money guides and build the free calculators behind them.