A practical walkthrough for computing inflation's effect on cash, future expenses, retirement income, and long-term savings — with worked dollar examples.
Inflation is the most invisible variable in personal finance. You feel it when groceries cost more or when your paycheck stretches less far than it did three years ago, but you don't actually see it as a number on a statement. There is no line item on your bank app that says "this account lost 3% of its real value this year." That's the trap — inflation only becomes the most important number in your planning the moment you sit down and compute it. Until then, it's noise.
This article is purely about the math. Not why inflation happens, not what the Federal Reserve does about it, not whether the current rate is too high or too low. By the end of the next few minutes, you'll be able to translate between past dollars, present dollars, and future dollars in about 30 seconds — using nothing more than a calculator and a simple compound-growth formula. That single skill is what separates retirement plans that survive 30 years from retirement plans that quietly run out of buying power around year 18.
If you want a deeper conceptual treatment of why inflation matters and how it works historically, the companion article understanding inflation and your money covers that ground. Here, we focus on the calculator-and-spreadsheet mechanics — the working formulas, the realistic rate assumptions, and the worked examples you can plug your own numbers into.
The Formula You Need
Inflation math runs on the same engine as compound interest — it's just compound growth working against you instead of for you. The two formulas you need are mirror images of each other:
Future value = Present value × (1 + inflation rate)^years
That tells you how many nominal dollars it will take in the future to buy what a given amount buys today. Flip it and you get:
Present value = Future value ÷ (1 + inflation rate)^years
That tells you what a future dollar amount is really worth in today's purchasing power.
These two equations cover roughly 90% of inflation math you'll ever do in personal finance. The inflation rate goes in as a decimal — 3% becomes 0.03, so (1 + 0.03) = 1.03 — and the years are simply the number of compounding periods. The exponent does the heavy lifting, because inflation, like investment returns, compounds. A 3% rate doesn't mean prices climb 30% over a decade. It means prices climb to 1.03^10 = 1.344, or about 34.4% — and over 30 years, prices roughly 2.43×.
Once you commit those two formulas to memory, the rest is choosing the right rate and being honest about your time horizon.
Step 1: Choose the Right Inflation Rate
The rate you plug in matters more than any other decision in this calculation. Pick poorly, and the math is precise but useless.
The long-run US average since 1925 is about 3% per year, give or take a few tenths depending on which window you measure. That's the number most financial planners default to for long-horizon work — retirement, college funding, FI projections, anything more than 10 years out. Over long stretches, short-term spikes and dips wash out and the historical average becomes a reasonable assumption.
The post-2020 environment has been less cooperative. US CPI ran hot from 2021 through mid-2023, with the trailing 12-month figure peaking above 9% in summer 2022 before drifting back. By 2025–2026, inflation has settled closer to the 2.5–3% range, but the volatility of the last few years is a useful reminder that the headline number can deviate sharply from the long-run average for years at a time.
A practical rule of thumb:
- 3% for long-range planning (retirement, college, 20+ year projections)
- Current trailing 12-month CPI for short-range decisions (1–3 year plans like a home down payment or a near-term savings goal)
One more wrinkle: the published CPI is a weighted national average. Your personal inflation rate — the rate at which your household's basket of goods rises — can deviate meaningfully if you spend disproportionately on housing, healthcare, education, or childcare. Renters in fast-growing metros and households with significant medical needs typically experience a higher personal rate than headline CPI suggests. If your situation looks unusual, it's worth nudging your assumed rate up by half a point.
Step 2: Translate Future Dollars to Today's Dollars
Here's the most common inflation calculation people actually need to do: how many future dollars will it take to fund a goal that feels sized in today's dollars?
Worked example #1 — retirement budget. You estimate you'd be comfortable retiring on $50,000 per year, in today's purchasing power. You're 20 years from retirement. At 3% inflation:
$50,000 × (1.03)^20 = $50,000 × 1.806 = $90,300
That means your first-year retirement budget, expressed in nominal dollars 20 years from now, needs to be about $90,300 — not $50,000 — to deliver the same lifestyle you imagine today. If your retirement plan targets $50,000 of annual income in year-20 nominal dollars, it's going to feel like roughly $27,700 of today's purchasing power. That gap is where retirements quietly fail.
Worked example #2 — retirement nest egg target. Suppose you've calculated that a $1.2M portfolio would safely fund your retirement at today's prices using a 4% withdrawal rule. You're 25 years out. At 3% inflation:
$1,200,000 × (1.03)^25 = $1,200,000 × 2.094 = $2,512,800
The number on the screen of your brokerage account at retirement needs a "2" in front of it, not a "1," for the same purchasing power. That's a stunning gap, and it's why our inflation calculator is worth running before you finalize any long-horizon savings target.
Worked example #3 — house down payment. You want to put $80,000 down on a starter home in 8 years. Real estate often inflates faster than CPI, but stick with 3% as a floor:
$80,000 × (1.03)^8 = $80,000 × 1.267 = $101,360
You should be saving toward roughly $101,000, not $80,000. And if housing in your market has been running closer to 5% per year, the realistic target is $80,000 × (1.05)^8 = $118,200.
The pattern: any goal you size in today's dollars must be inflated forward before you decide how much to save monthly.
Step 3: Translate Past Dollars to Today's Dollars
The same formula runs in reverse when you want to compare historical dollar amounts to today. This is how you make sense of statements like "my grandfather paid $25,000 for his first house," or "my starting salary in 1995 was $32,000," or "she left me a $5,000 inheritance in 1985."
Worked example — the 1985 inheritance. Your grandfather left $5,000 in 1985. From 1985 to 2026 is 41 years. Using the long-run average of about 3% — and noting that BLS CPI data shows actual cumulative inflation between 1985 and 2026 lands close to this — the calculation is:
$5,000 × (1.03)^41 ≈ $5,000 × 3.34 = about $16,700
Real BLS CPI numbers put 1985 dollars at roughly $14,500–$16,700 in 2026 depending on the exact month, but the 3% estimate gets you in the right zip code without needing to look anything up. So that $5,000 had the same buying power as roughly $14,500–$16,700 today — meaningful money, but not life-changing.
This same translation tool is useful for evaluating salary history (your $40,000 salary in 2005 is worth about $66,000 in 2026 dollars), assessing whether a relative was "rich" by today's standards, and sanity-checking inflation-adjusted statistics in the news.
For exact historical conversions, the BLS publishes a CPI inflation calculator that uses real measured CPI data rather than a flat 3% assumption. Use the formula above for quick estimates; use BLS data when you need precision for a specific year.
Step 4: Quick Mental Math (the Rule of 72 in Reverse)
The Rule of 72 is famous for investing — divide 72 by your return rate and you get the number of years to double your money. The same rule works in reverse for inflation: divide 72 by the inflation rate, and you get the number of years for your purchasing power to be cut in half.
- At 3% inflation → 72 ÷ 3 = 24 years to lose half your buying power
- At 4% inflation → 72 ÷ 4 = 18 years
- At 5% inflation → 72 ÷ 5 = 14.4 years
- At 8% inflation → 72 ÷ 8 = 9 years
This is the single most useful piece of mental math in personal finance for sanity-checking long-range plans. It answers questions like:
- "How much cash is too much to be holding?" — If you've got a five-figure cash position earning effectively nothing, half of it will quietly evaporate in real terms over the next 24 years at 3% inflation.
- "How fast does my emergency fund lose meaningful value?" — Slowly enough that you shouldn't panic, but real enough that parking it in a high-yield savings account at 4–5% is a measurable improvement over a checking account at 0.01%.
- "Is a pension that doesn't adjust for inflation a good deal?" — A fixed nominal pension loses half its real value in about 24 years. For a 65-year-old retiring with a 30-year horizon, that's a significant haircut by the end.
Step 5: Combine Inflation with Investment Returns
This is where inflation math becomes most powerful — when you bring it into the same calculation as your investment returns.
The shortcut formula is real return = nominal return − inflation rate. It's an approximation, but a close one. The precise version is:
real return = (1 + nominal return) ÷ (1 + inflation) − 1
For a 10% nominal return and 3% inflation, the shortcut gives 7%. The exact formula gives 6.80%. Close enough for most planning. The shortcut is fine when both numbers are small (and the gap between them is the number you care about).
Worked example — stock market projection. You expect roughly 10% nominal returns from a diversified stock portfolio over the long run (this is the historical average — your actual results will vary widely). With 3% inflation, your real return is about 7%.
For a 30-year projection of $10,000 invested today:
- Nominal view (at 10%): $10,000 × (1.10)^30 = $174,494. That's what your brokerage statement will read in 30 years.
- Real view (at 7%): $10,000 × (1.07)^30 = $76,123. That's what those dollars will actually buy in today's purchasing power.
Both are correct. Both are useful. The trap is mixing them — projecting nominal growth and then thinking about the result as if it were in today's dollars. That's how people end up disappointed at retirement.
A clean planning convention: do everything in today's dollars using real returns. Project savings, project growth, project withdrawals — all in today's purchasing power, using the real rate of return. It's mentally easier because the dollar amounts feel like the prices you live with now, and it automatically bakes in the inflation adjustment without you having to convert anything. The compound interest calculator and savings goal calculator let you experiment with both views.
Step 6: Plan Retirement Income for Inflation Protection
Of every application of inflation math, retirement income planning is by far the most important — and the one most commonly mishandled.
The reason: retirement is a 25–30 year span, and inflation compounds the entire way. A budget that feels comfortable in year 1 will feel cramped by year 15 and inadequate by year 25 if it doesn't grow.
Worked example. You retire at 65 with a budget of $60,000/year in 2026 dollars and live to 95. At 3% inflation:
| Year | Age | Nominal annual budget |
|---|---|---|
| 1 (2026) | 65 | $60,000 |
| 10 (2035) | 75 | $80,600 |
| 20 (2045) | 85 | $108,400 |
| 30 (2055) | 95 | $144,200 |
By the final year of a 30-year retirement, your nominal budget — to maintain the same lifestyle — is roughly 2.4× the starting figure. Plans that quote a single number ("I'll need $60K a year") without acknowledging this growth tend to fall apart in the second half.
Strategies that help retirement income keep up with inflation:
- TIPS (Treasury Inflation-Protected Securities) — principal adjusts with CPI, so coupon payments rise with inflation
- I Bonds — composite rate ties to CPI; useful for the conservative slice of a retirement allocation
- Equity exposure — stocks have historically outpaced inflation over long periods, though year-to-year correlation is weak
- Real estate — both owned property and REITs have track records of inflation resilience over decades
For personalized retirement income planning, consider working with a CFP — the letsmakeaplan.org directory is a starting point for finding fiduciary planners.
The Categories That Inflate Faster
Headline CPI is a weighted average across hundreds of categories. Some run hotter than the headline for long stretches, which matters if those categories dominate your personal budget.
| Category | Typical long-run inflation | Notes |
|---|---|---|
| Housing (major metros) | 4–6% | Rent and home prices have outpaced CPI in most high-demand markets for decades |
| Healthcare | 4–5% | Typically 1–2 percentage points above headline CPI; matters more as you age |
| Education (college tuition) | 5–6% | Has substantially outpaced CPI for over 40 years |
| Energy | Volatile | No consistent trend; can spike or fall sharply in any given year |
| Food at home | Tracks CPI | Roughly tracks headline, with some volatility |
| Apparel | Below CPI | Has been near-flat or deflationary for years |
If your household spends a large share on housing, healthcare, or education, plan against a personal inflation rate of 4–4.5% rather than the 3% headline. Use the inflation calculator to model both scenarios — headline and a heavier personal rate — and use the difference as your planning safety margin.
Common Mistakes
- Confusing nominal and real returns. Projecting 10% nominal growth and then treating the result as today's dollars overstates real wealth by 2–3× over 30 years.
- Using arithmetic averages of past inflation rates. Compound (geometric) growth is what matters. Two years of 8% followed by two years of -2% isn't a 3% average — the math is multiplicative.
- Forgetting inflation in long-horizon planning entirely. Many retirement and college plans quote a single dollar figure with no growth adjustment. After 25 years, the gap is enormous.
- Holding too much cash. Cash earning nothing loses purchasing power every year. The inflation tax compounds the same way investment returns do — just against you.
- Assuming wages keep up with inflation. Over long periods they roughly do; over short periods they often don't, especially during inflationary spikes when raises lag price increases by 1–2 years.
- Picking the wrong inflation rate for the horizon. Don't use the current trailing rate for a 30-year plan, and don't use the 100-year average for a 2-year savings goal.
- Treating headline CPI as your personal rate. Your basket isn't the BLS basket. Adjust for housing and healthcare weighting.
- Ignoring that fixed-rate debt benefits from inflation. A 30-year mortgage at 6% becomes easier to pay as your nominal income rises with inflation while your payment stays flat. This is one of the few places inflation works for you.
Frequently Asked Questions
What inflation rate should I use for retirement planning? For long-horizon retirement projections (15+ years out), 3% is the standard planning assumption — it matches the long-run US historical average. If you're more conservative or your spending leans heavily on healthcare and housing, model 3.5–4% as a safety margin.
Does inflation affect my fixed-rate mortgage? Yes — favorably. Your nominal monthly payment doesn't change, but as inflation pushes nominal wages and prices up over the loan's life, that fixed payment shrinks in real terms. A $2,500 monthly payment that felt tight at year 1 will feel mild by year 20. This is why fixed-rate debt is often called an "inflation hedge."
How do I know my personal inflation rate? Track your actual annual spending across major categories (housing, food, healthcare, transportation, etc.) for two or three years and compare the year-over-year changes. Households heavy in housing and healthcare typically run 0.5–1.5 percentage points above headline CPI.
Is hyperinflation a realistic risk? True hyperinflation (50%+ monthly) is extremely rare in developed economies with floating fiat currencies and credible central banks. Bouts of elevated inflation (5–10%) are realistic and have occurred multiple times in recent US history. Plan against the latter, not the former.
Should I prefer real or nominal returns for planning? Real returns. Doing your planning in today's-dollars with real returns is simpler and less error-prone. The numbers feel grounded in prices you actually live with, and inflation is automatically baked into the calculation.
How can I beat inflation with my savings? Cash in a high-yield savings account at 4–5% can roughly match recent inflation. Stocks, real estate, TIPS, and I Bonds are the most common longer-term inflation-resistant assets. Diversifying across these — rather than relying on cash alone — is the standard approach.
Next Steps
You now have the formulas and the realistic rate assumptions to compute inflation's impact on any dollar amount, in any direction, across any time horizon. Here's how to put it to use today:
- Run your own numbers through the inflation calculator. Plug in a future goal (retirement, college, down payment) and see what it looks like in nominal dollars across different inflation assumptions.
- Recheck your long-term savings projections with real returns. Use the compound interest calculator at both a nominal rate (e.g., 10%) and a real rate (e.g., 7%) — and decide which view you'll plan against going forward.
- Resize your savings goals for inflation. Use the savings goal calculator to update any goal sized in today's dollars to its future nominal target.
If you want the deeper conceptual background on what inflation is and why it happens, read the companion article on understanding inflation and your money. For personalized retirement income planning that weaves inflation into a full financial plan, a CFP from the letsmakeaplan.org directory can help. The math in this article will get you a long way on your own — but a planner is worth the conversation when the stakes are big enough.
This article is educational and not personalized financial advice. Dollar examples are rounded for clarity. Actual inflation rates and investment returns will vary.
Run the numbers
Everything below came out of this site's own Savings Goal Calculator. The figures are not quoted from anywhere else: each row is one run of the same calculation the tool page performs, using August 2026 rules. Put the same inputs in and you will get the same output.
How the result moves with goal
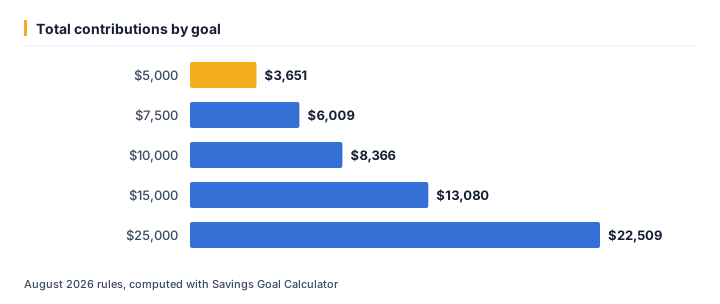
We ran 5 values of goal through the calculator and left every other input at its default. As of August 2026, the output was:
| Goal ($) | Total contributions ($) | Interest earned ($) | Needed ($) |
|---|---|---|---|
| 5,000 | 3,651.45 | 348.55 | 4,000 |
| 7,500 | 6,008.61 | 491.39 | 6,500 |
| 10,000 | 8,365.77 | 634.23 | 9,000 |
| 15,000 | 13,080.09 | 919.91 | 14,000 |
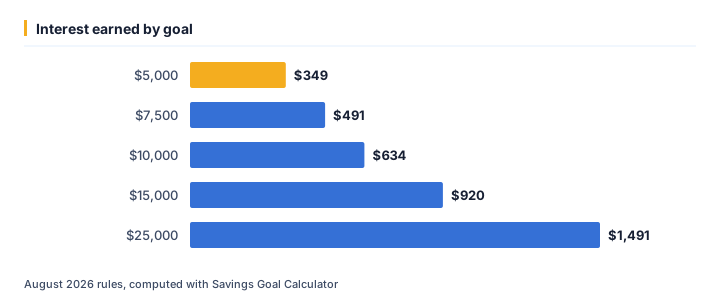
| 25,000 | 22,508.72 | 1,491.28 | 24,000 |
Running goal from $5,000 up to $25,000 moves total contributions from $3,651 to $22,509 — a spread of $18,857. That gap is the part a single headline rate never shows.
The same runs seen through interest earned
At $5,000, interest earned works out to $349; at $25,000 it is $1,491. Looking only at total contributions tends to understate how much the outcome shifts across that range.
One example, straight from the API
The middle row above (goal = $10,000) is not a rounded illustration — it is exactly what /api/v1/tools/savings-goal-calculator/calculate returns for that input, August 2026 rules:
{
    "tool": "savings-goal-calculator",
    "inputs": {
        "goal": 10000,
        "current": 1000,
        "years": 3,
        "rate": 4
    },
    "result": {
        "months": 36,
        "needed": 9000,
        "monthly_savings_required": 232.38,
        "total_contributions": 8365.77,
        "interest_earned": 634.23
    }
}
Assumptions behind these figures
| Input | Value |
|---|---|
| Goal | $10,000 |
| Current | $1,000 |
| Years | 3 years |
| Rate | 4% |
| As of | August 2026 |
| Method | identical to /tools/savings-goal-calculator |
Rates, thresholds and typical costs change over time; the numbers above are accurate as of August 2026, not a permanent guarantee. For your own situation, open the Savings Goal Calculator and enter your real numbers — the calculator runs the same code that produced every figure on this page.
Ready to crunch your numbers?
Open the Compound Interest Calculator and get an answer in seconds.
Editorial Team
We write plain-English money guides and build the free calculators behind them.