Inflation is the quiet tax on cash, the silent hurdle every long-term investment has to clear, and the reason 'just keep saving' is not actually enough. Here is exactly how it works and what to do about it.
Inflation is the quietest financial story in any household. It does not show up as a line item on your bank statement. It does not trigger a notification. Yet it is the reason a $50,000 emergency fund today is worth roughly $37,000 in purchasing power ten years from now if it sits in a low-yield account. The corrosion is invisible, gradual, and — across a working lifetime — enormous.
This guide unpacks what inflation actually is, how it shows up in your real expenses, why averaged statistics often understate the version most households experience, and the specific moves that protect long-term savings from quiet erosion.
What Inflation Actually Is
Inflation is the general rise in prices across the economy, measured as a percentage change over a period (usually a year). If the inflation rate is 3% this year, a $100 basket of goods that you could buy on January 1 costs $103 by December 31. Same goods. Same quantity. Just more dollars required to get them.
The reason inflation feels invisible is that price changes accumulate slowly and unevenly. A coffee that cost $2.50 in 2010 and costs $4.50 in 2026 did not jump all at once. It climbed 10 cents here, 25 cents there, sometimes years between increases. The cumulative arithmetic — what the US Bureau of Labor Statistics calls the Consumer Price Index (CPI) — captures the basket-wide creep.
Why it matters: every dollar of cash you hold loses purchasing power at the inflation rate. If you stash $20,000 in a checking account at 0.01% interest while inflation runs at 3%, you have not "saved" $20,000 — you have functionally lost $600 of buying power in the first year alone, and the loss compounds.
How Inflation Is Measured
The headline US inflation number is the Consumer Price Index for All Urban Consumers (CPI-U), published monthly by the Bureau of Labor Statistics. It tracks a basket of about 80,000 prices across roughly 200 categories: housing, food, transportation, medical care, education, apparel, recreation, and so on. The basket is weighted by how much an average urban household spends in each category.
CPI-U has two important features worth knowing:
It is an average across the US, weighted by an "average" household. Your personal inflation rate is almost certainly different. If 50% of your budget is rent and your landlord raises rent 8% this year while CPI shows 3%, your personal inflation rate is closer to 5% than 3%.
The basket is updated periodically. The Bureau adjusts the basket as consumption patterns shift (more streaming, less cable; more EVs, less gasoline). This is technically correct but creates a debate about whether the official index understates "lived" inflation, particularly for older Americans whose consumption patterns change more slowly than the basket.
A second commonly cited measure is Core CPI, which excludes food and energy. The argument: food and energy prices are volatile and noise-prone, so the underlying trend is easier to see without them. The counter-argument: food and energy are exactly what households actually pay for, so excluding them produces an inflation number that is more comfortable than accurate. Both numbers are useful; neither is the whole picture.
US Inflation: Recent History in Context
The post-2000 US inflation experience, in rough strokes:
- 2000–2007: ~2–3% annual CPI. The "moderate inflation" backdrop most personal finance advice was written against.
- 2008–2009: Briefly negative (deflation) during the financial crisis.
- 2010–2019: ~1–2% annual CPI. A historically low decade, in part because of slow wage growth and globalization keeping goods prices flat.
- 2020: ~1.4% — pandemic-suppressed demand kept measured inflation low even as supply chains were already fraying.
- 2021: ~7.0% — the most dramatic year-over-year jump in 40 years, driven by stimulus, supply chain disruption, and shifting consumption patterns.
- 2022: ~8.0% — the peak; Fed began aggressive rate hikes mid-year.
- 2023: ~3.4%, normalizing.
- 2024–2025: ~2.5–3.0%, hovering near the Fed's 2% target band.
- 2026 (year-to-date): tracking around 2.5–3.0%.
The 100-year US average is roughly 3% annually — but the past 40 years have seen long stretches both above and below that level. For long-range financial planning, 3% remains the standard assumption. For short-range planning (1–3 years), use the current trailing rate.
The Quiet Power of Compound Inflation
The same compounding math that makes investing powerful makes inflation corrosive in the opposite direction.
A $100 basket of goods at 3% annual inflation costs:
- 5 years later: $115.93
- 10 years later: $134.39
- 20 years later: $180.61
- 30 years later: $242.73
- 40 years later: $326.20
Put differently: at 3% inflation, the dollars you save today buy roughly half as much 25 years from now. A $5,000 monthly retirement budget in 2026 dollars needs to be roughly $10,500 in 2051 nominal dollars to deliver the same lifestyle.
The Inflation Calculator does this conversion in both directions: enter past dollars to see today's equivalent, or enter today's dollars to see what you will need in the future to preserve purchasing power. Use it whenever a personal finance decision spans more than 5 years.
Categories That Hurt Households Most
Inflation is rarely uniform. Some categories run hotter than the headline number for years at a time, with outsized effects on households whose budgets concentrate there.
Housing
The single largest line item in most US household budgets, and the one most resistant to substitution. Rent inflation in major metros over the past decade has averaged 4–6% annually, well above headline CPI. Home prices have grown even faster in many markets — though these only affect a household at the moment of purchase, not month to month.
Protection: lock in a long-term fixed-rate mortgage when affordable. Renters have less direct protection; the best strategies are signing 18–24 month leases when offered, building leverage to negotiate at renewal, and being willing to move when a market becomes unsustainable.
Healthcare
Medical care inflation has historically run 1–2 percentage points above headline CPI. Insurance premiums, deductibles, and pharmaceutical out-of-pocket costs all tend to rise faster than wages.
Protection: maximize HSA contributions if eligible (triple-tax-advantaged), choose insurance plans with appropriate deductible levels for your household, and budget for healthcare costs to grow faster than other categories.
Education
College tuition inflation has averaged 5–6% annually for decades. The single most aggressive line item in the typical household budget.
Protection: 529 plan contributions started as early as possible (the compounding math is the only realistic counter), in-state public university preference for affordability, and serious skepticism of high-tuition private schools without commensurate aid packages.
Food
Generally tracks headline CPI but spikes during supply chain shocks (as in 2022). Restaurant food has consistently outpaced grocery inflation in recent years.
Protection: less concentrated than housing or education. The realistic move is to keep restaurant spending as a flexible want rather than a fixed monthly habit.
Energy
The most volatile category. Year-to-year swings of ±20–30% on gasoline and home heating costs are normal. Headline CPI inflation hides this volatility because energy is a smaller weight in the basket.
Protection: structural moves (efficient vehicle, well-insulated home, solar where economical) rather than tactical ones. Trying to time gasoline purchases is rarely worth the effort.
The Inflation Trap for Cash Savers
The most common personal finance mistake driven by inflation: holding too much cash in low-yield accounts for too long.
A household with $80,000 sitting in a checking account paying 0.01% loses roughly:
- $2,400 of purchasing power in year 1 at 3% inflation
- $4,750 in years 1–2 combined
- $11,000 in years 1–5 combined
- $25,000 in years 1–10 combined
That $25,000 is invisible because the nominal checking balance stayed at $80,000 the whole time. The household feels prudent. The math says otherwise.
The fix is twofold:
Right-size the emergency fund. Hold what you genuinely need (3–9 months of essential expenses depending on situation — see How Much Emergency Fund Do You Really Need?) in cash equivalents. Anything beyond that goes into investments.
Move the emergency fund itself to a high-yield account. As of 2026, leading HYSAs pay rates that roughly track short-term Treasury bills — meaningfully positive in inflation-adjusted terms in some years, modestly negative in others. Still better than 0.01% checking, which is unambiguously a loser to inflation every year.
Cash beyond the emergency fund — money you would not need for 5+ years — does not belong in any savings account. It belongs in a long-horizon investment portfolio where the expected real return is positive.
What Beats Inflation Over the Long Run
Asset classes ranked roughly by historical long-run inflation-beating performance:
- Diversified stock portfolios. Real (inflation-adjusted) returns of ~7% annually over the long-run US history. The reliable inflation-beater for any 15+ year horizon.
- Real estate. Property values tend to track or slightly exceed inflation in real terms; rental income also typically inflates. Less liquid, more concentration risk.
- Treasury Inflation-Protected Securities (TIPS). Principal adjusts with CPI; coupon paid on the adjusted principal. Guarantees a small real return; useful for retirement income protection.
- I Bonds. US Treasury savings bonds with a variable rate tied to CPI. Limited annual purchase amount ($10,000 per person), early redemption penalty in the first 5 years.
- Short-term Treasuries / HYSAs. Track inflation roughly during normal periods; lag during high-inflation periods (as in 2022).
- Long-term bonds. Generally lose to inflation over long periods unless purchased at very high starting yields.
- Cash / checking accounts. Reliably lose to inflation every single year.
For the typical working-age household, the practical playbook is:
- Emergency fund in an HYSA (close to inflation).
- Retirement savings in low-cost diversified index funds (well above inflation over 15+ years).
- A small TIPS or I Bond allocation as you approach or enter retirement (specific inflation hedge for retirement income).
When Inflation Helps You
It is not all bad news for borrowers. Fixed-rate debt becomes easier to repay in real terms during inflationary periods because you are paying back tomorrow's cheaper dollars with today's higher wages.
A $300,000 30-year fixed mortgage at 4% taken out today is, in inflation-adjusted terms, a steadily shrinking obligation. If inflation runs at 3% over the life of the loan, the final-year mortgage payment is roughly half the real burden of the first-year payment.
This is also true for student loans (especially fixed-rate federal loans) and any other long-duration fixed-rate debt. The implication: aggressively paying down low-interest fixed-rate debt during high-inflation periods is often worse mathematically than investing the same dollars. The 4% mortgage rate is a near-certainty 4% nominal cost; the inflation-adjusted real cost is closer to 1%, which is much easier to beat in a long-run equity portfolio.
This logic does not apply to variable-rate debt or short-duration debt — both of which reset to current rates and lose the inflation tailwind.
Frequently Asked Questions
Should I keep more cash during high-inflation periods? The opposite, generally. High-inflation periods are exactly when cash loses purchasing power fastest. The right-sized emergency fund still belongs in cash; everything beyond that belongs in investments that have a chance of beating inflation.
Is gold a good inflation hedge? Modestly, over very long horizons. Over shorter horizons (10–20 years), gold has been an inconsistent inflation hedge — sometimes outperforming, sometimes underperforming. Diversified equities have been a more reliable inflation-beater historically, with much better total returns. A small gold allocation (1–5%) is defensible as a diversifier; gold as a primary inflation hedge is not supported by the data.
Does inflation hurt retirees more? Yes, generally — for three reasons. Retirees often hold larger cash positions; their consumption baskets weight more toward healthcare (faster inflation than headline); and they cannot increase income to offset rising prices the way working adults can. Healthy retirement plans build in 3% annual inflation as a baseline and stress-test for higher rates.
Should I get a fixed or variable mortgage when inflation is rising? Fixed, almost always. Variable-rate (ARM) mortgages reset upward when inflation drives rates up — exactly the wrong direction. Fixed rates lock in today's cost in nominal terms and let inflation work for you over the life of the loan. The exception: very short planned ownership (under 5 years), where the lower initial rate on an ARM may make sense.
How do I calculate "today's dollars" for a future expense? Divide the future dollar amount by (1 + inflation rate) raised to the number of years. For example, $50,000 in 20 years at 3% inflation has a present-day equivalent of $50,000 ÷ (1.03)^20 = $27,684. The Inflation Calculator does this in one step.
Is wage growth keeping up with inflation? Variable by year and by industry. In some years (e.g., 2022) inflation outpaces wages and households lose real purchasing power; in other years (e.g., 2024–2025) wages catch up. Plan as if wages will roughly track inflation over a career, but no individual year. The implication: do not rely on raises to offset inflation in retirement planning; build inflation-protection into the investment side.
Next Steps
- Use the Inflation Calculator to translate one specific future expense — a college tuition target, a retirement budget, a home down payment goal — into today-dollar terms. The number you need to save changes dramatically once inflation enters the picture.
- Audit your cash positions. Sum your checking + savings + any unused money market or low-yield accounts. If the total is more than 9 months of essential expenses, the excess is losing purchasing power. Move it to a long-horizon investment account.
- If you have a fixed-rate mortgage at a competitive rate (say, under 5%), think twice before "extra principal payments." The inflation-adjusted return on that paydown is much lower than what an equivalent investment in equities would deliver. The boring path of "minimum mortgage, max equity contributions" is usually right.
Inflation is the financial story that does not announce itself. The households that handle it well are the ones who stopped treating cash as the default savings vehicle decades before they actually need the money. Today is a perfectly reasonable day to start.
Run the numbers
Everything below came out of this site's own Savings Goal Calculator. The figures are not quoted from anywhere else: each row is one run of the same calculation the tool page performs, using August 2026 rules. Put the same inputs in and you will get the same output.
How the result moves with goal
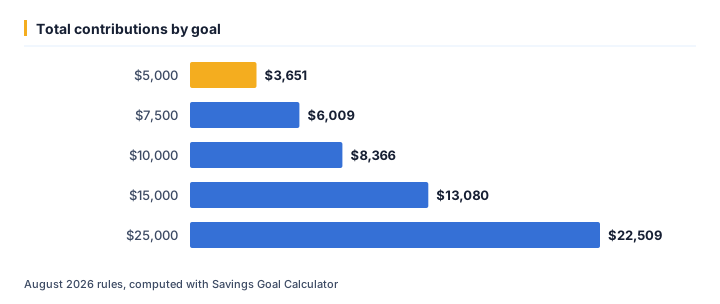
We ran 5 values of goal through the calculator and left every other input at its default. As of August 2026, the output was:
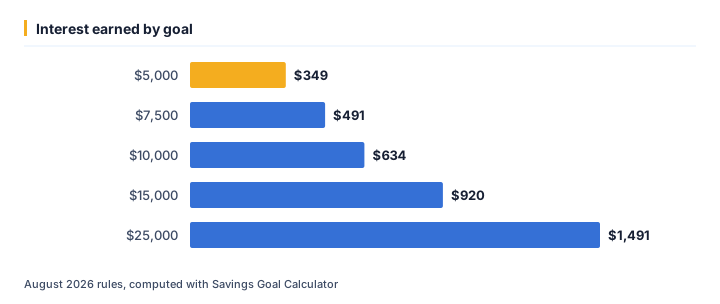
| Goal ($) | Total contributions ($) | Interest earned ($) | Needed ($) |
|---|---|---|---|
| 5,000 | 3,651.45 | 348.55 | 4,000 |
| 7,500 | 6,008.61 | 491.39 | 6,500 |
| 10,000 | 8,365.77 | 634.23 | 9,000 |
| 15,000 | 13,080.09 | 919.91 | 14,000 |
| 25,000 | 22,508.72 | 1,491.28 | 24,000 |
Running goal from $5,000 up to $25,000 moves total contributions from $3,651 to $22,509 — a spread of $18,857. That gap is the part a single headline rate never shows.
The same runs seen through interest earned
At $5,000, interest earned works out to $349; at $25,000 it is $1,491. Looking only at total contributions tends to understate how much the outcome shifts across that range.
One example, straight from the API
The middle row above (goal = $10,000) is not a rounded illustration — it is exactly what /api/v1/tools/savings-goal-calculator/calculate returns for that input, August 2026 rules:
{
    "tool": "savings-goal-calculator",
    "inputs": {
        "goal": 10000,
        "current": 1000,
        "years": 3,
        "rate": 4
    },
    "result": {
        "months": 36,
        "needed": 9000,
        "monthly_savings_required": 232.38,
        "total_contributions": 8365.77,
        "interest_earned": 634.23
    }
}
Assumptions behind these figures
| Input | Value |
|---|---|
| Goal | $10,000 |
| Current | $1,000 |
| Years | 3 years |
| Rate | 4% |
| As of | August 2026 |
| Method | identical to /tools/savings-goal-calculator |
Rates, thresholds and typical costs change over time; the numbers above are accurate as of August 2026, not a permanent guarantee. For your own situation, open the Savings Goal Calculator and enter your real numbers — the calculator runs the same code that produced every figure on this page.
Ready to crunch your numbers?
Open the Compound Interest Calculator and get an answer in seconds.
Editorial Team
We write plain-English money guides and build the free calculators behind them.